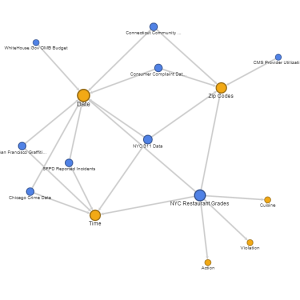
Using a Google Fusion Tables Network Graph to Visualize a Conformed Data Model
Documenting data models can be painstakingly boring, but having documentation available when building, modifying and using data models can save time and effort on an order of magnitude. Most documentation…
An Entire City Mapped in a Day at Mapbox
Have you ever browsed open data sets, and realized that open data is loaded with GIS data? When searching the web for new open data visualizations, I stumbled across Mapbox.…
Flowing Data Maps a Century of Earthquakes
If you have an interest in visualizing data, then you should be visiting the site Flowing Data on a regular basis. The author is Dr. Nathan Yau (PhD), and he provides fantastic examples…
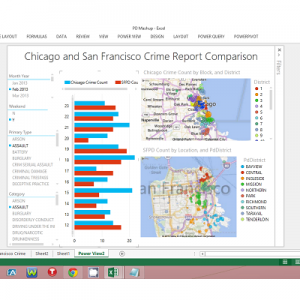
Instructional Video to Mashup Chicago and San Francisco Crime and Police Open Data
Open Data Bits has created the above video to provide value in a few different ways: This video gives instructions for using the Open Data Bits library to create your…
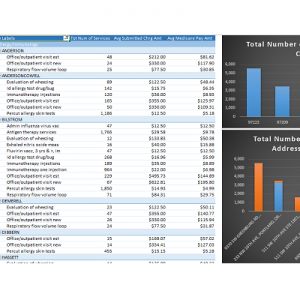
CMS Medicare Provider Utilization and Payment Data Now Featured at Open Data Bits
The Centers for Medicare and Medicaid Services (CMS) has recently released Medicare Provider Utilization and Payment Data at the detail level of Physicians and Other Suppliers. This release of open data…


