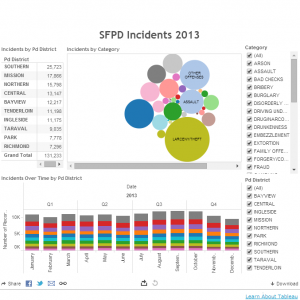
An Interactive Data Visualization Dashboard of San Francisco Police Reports in 2013
San Francisco Police Reports 2013 Dashboard (click the filter values and hover over bubbles and bar graph colors, it's interactive!) Learn About Tableau The above dashboard visualizes San Francisco Police…
Video Tutorial on Scatter Charts for Data Visualization
Earlier this month I posted an article reviewing the basic principles of scatter charts for data visualization. The article received quite a few hits and links, so I went ahead…
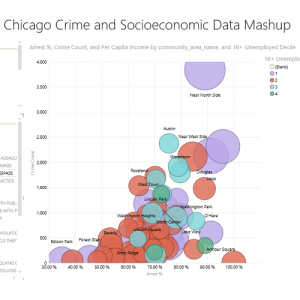
Combine Chicago Crime Data with Census Data for New Insights
The City of Chicago provides access to crime data through their open data portal. Another data set at their portal, which originates from an entirely different source, is for census…
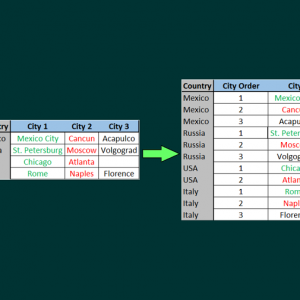
Video Tutorial to Unpivot Data Columns to Rows Using Excel with Power Query
Quite often, data sets will store similar or identical attributes in columns instead of rows. When mashing up data or analyzing data using business intelligence tools, keeping data in rows…
Chicago Socioeconomic Indicator Data Added to Our Library
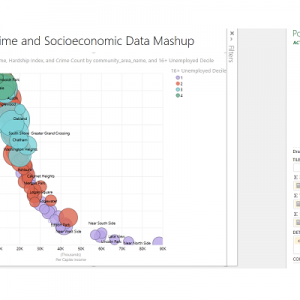
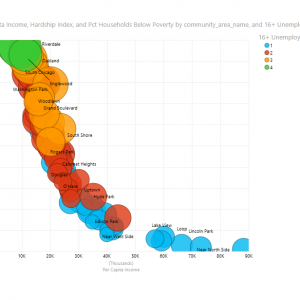
The above bubble chart graphs Chicago socioeconomic factors by Community Area. You can see that as Per Capita Income rises the Hardship Index decreases, the percentage of households below poverty…
Build Your Own Great Britain Road Safety Data Model
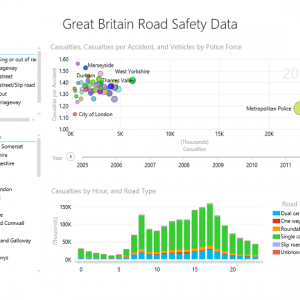
The United Kingdom has a robust, accessible, and useful open data portal. One of the data sets that has been made available to the public is Road Safety Data from…
The Secrets of Open Data Success in Helsinki Reviewed at The Atlantic Cities
A recent article in The Atlantic Cities reviews the path that Helsinki, Finland has taken to open data success. Paperless city record systems, open databases, and apps that help the…
Esri uses Open Data to create Tornado Impact Maps
On April 27, 2014 some serious tornadoes ripped through Arkansas. While sorting through some search engine results for recent open data articles, I came across a post from Esri that visualizes…
Film Locations in San Francisco Added to our Mashup Library
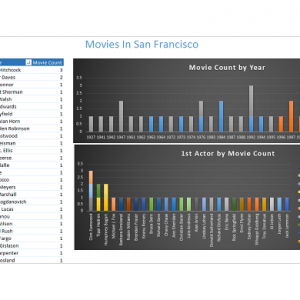
There are many interesting data sets to be found in San Francisco's open data portal, but Film Locations in San Francisco was an unexpected surprise. We recently used this data…
Tutorial Video Uses an OData Feed to Pull Data into Excel using Power Query and Power Pivot
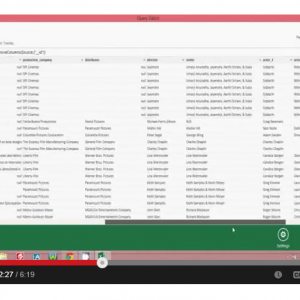
Many open data sets are made available via OData feeds. An OData feed is a standardized protocol for data consumption. Learn more about OData feeds at this link. The video embedded…

