Build Your Own Great Britain Road Safety Data Model
The United Kingdom has a robust, accessible, and useful open data portal. One of the data sets that has been made available to the public is Road Safety Data from the Department for Transport. The data set contains a wealth of information about accidents that involved casualties in Great Britain. Documentation for this data to help you access, mash up, and build your own dynamic analytic reports is now available in the Open Data Bits library.
The Great Britain Road Safety Data contains dozens of unique attributes that can be used to slice and dice data. An extensive and useful business intelligence data model can be built out with minimal effort, but the full value of the data set can be realized with a little bit of ETL work between the relational tables. Our documentation highlights the parts of the data model that should be reserved for users having ETL tools. You can visit our step-by-step instructions for building your own data model by clicking here.
For the examples below, the full data set was modeled and pulled into Power Pivot for Excel 2013. The resulting data model was then used to create the interactive examples.
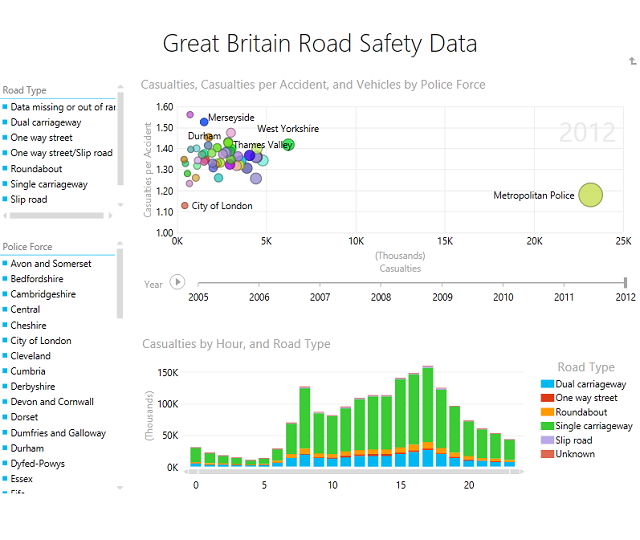
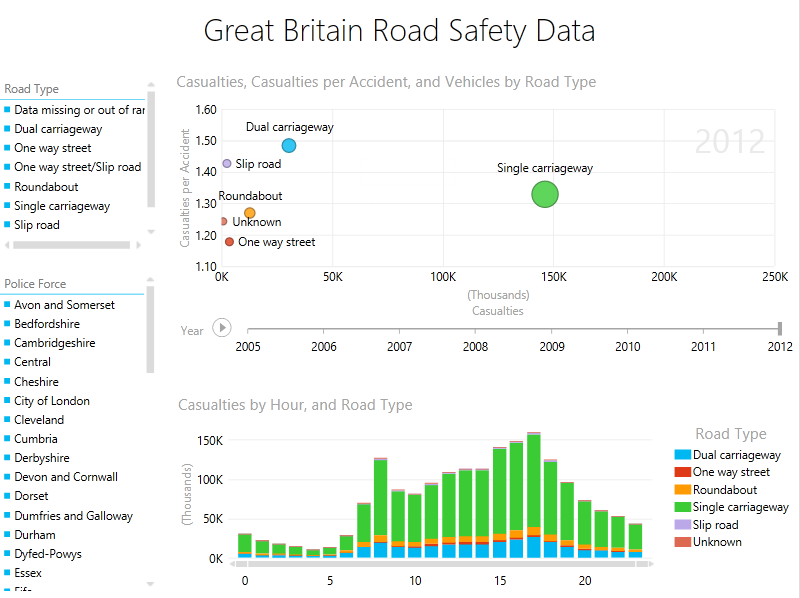
Using Power View for Excel 2013, a high level view shows the relationship between 1) different Road Types (by Casualties, Casualties per Accident, Total Vehicles, and Year) in the top chart and 2) hour of the day by Road Type in the bottom chart. Attributes for Road Type and Police Force were selected from dozens of choices to be used as filters:
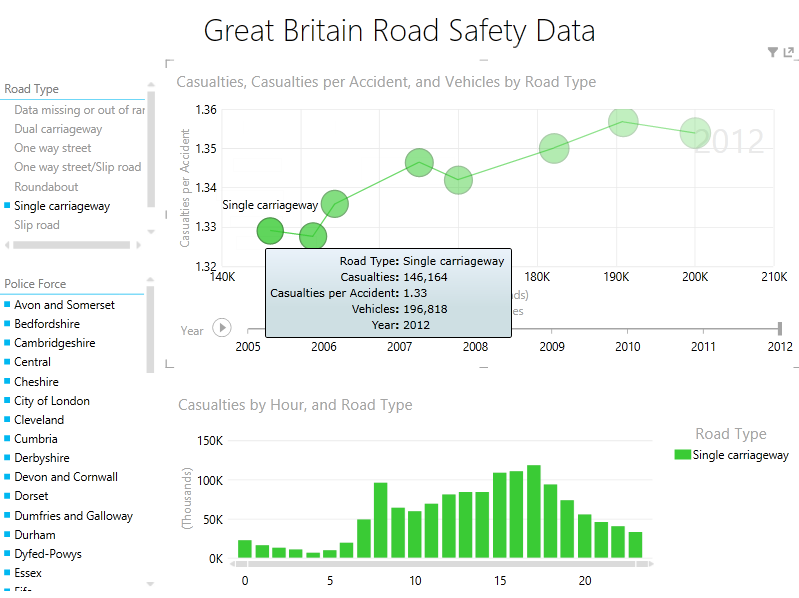
Filtering for the Road Type Single Carriageway shows that within the data set, Total Casualties and Casualties per Accident appear to trend downwards from 2005-2012:
A step-by-step process is documented at this link which you can use to build your own Road Safety Data business intelligence reports. As always, questions and feedback are welcome.