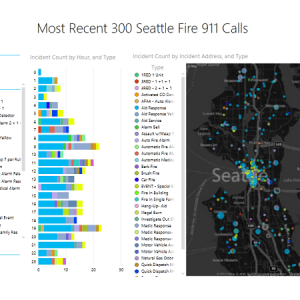
Seattle Real Time Fire 911 Calls API Data pulled into Excel for analysis using Microsoft BI tools Power Pivot, Power Query, & Power View
The above video walks through the process by which to use an API to pull data into Excel from a real time database of public information. Note that the database,…
A Web Based Interactive Dashboard Using Tableau Public
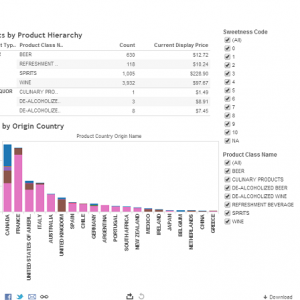
BC Liquor Store Product Price List Dashboard It's a live interactive dashboard, give it a try! Learn About Tableau Yesterday I posted an article detailing the use of a liquor…
Video Tutorial on Scatter Charts for Data Visualization
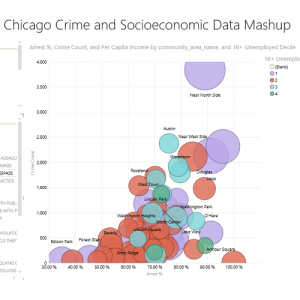
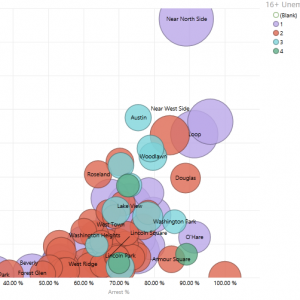
Earlier this month I posted an article reviewing the basic principles of scatter charts for data visualization. The article received quite a few hits and links, so I went ahead…
Pull openFDA API Data into a Pivot Table using Microsoft Excel
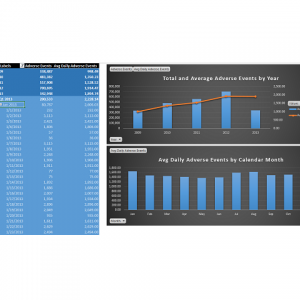
The United States Food and Drug Administration has launched a new open data site called openFDA. The site is currently in Beta testing, and provides API access to over 3…
Understanding and Using Scatter Charts – One of the Most Powerful Data Visualization Tools
Bar charts, line charts, and pie charts are the staple data visualization tools that most people use to present and consume data. If you've ever explored the chart types in…
Video Tutorial to Unpivot Data Columns to Rows Using Excel with Power Query
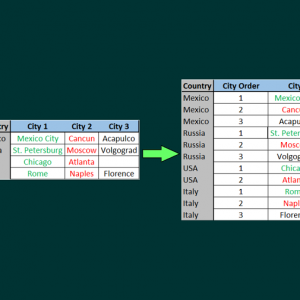
Quite often, data sets will store similar or identical attributes in columns instead of rows. When mashing up data or analyzing data using business intelligence tools, keeping data in rows…
The Secrets of Open Data Success in Helsinki Reviewed at The Atlantic Cities
A recent article in The Atlantic Cities reviews the path that Helsinki, Finland has taken to open data success. Paperless city record systems, open databases, and apps that help the…
Esri uses Open Data to create Tornado Impact Maps
On April 27, 2014 some serious tornadoes ripped through Arkansas. While sorting through some search engine results for recent open data articles, I came across a post from Esri that visualizes…
Tutorial Video Uses an OData Feed to Pull Data into Excel using Power Query and Power Pivot
Many open data sets are made available via OData feeds. An OData feed is a standardized protocol for data consumption. Learn more about OData feeds at this link. The video embedded…
Using a Google Fusion Tables Network Graph to Visualize a Conformed Data Model
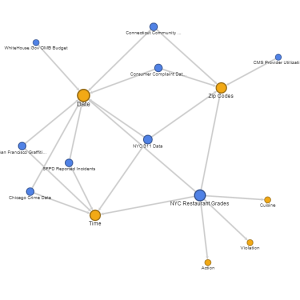
Documenting data models can be painstakingly boring, but having documentation available when building, modifying and using data models can save time and effort on an order of magnitude. Most documentation…

