Chicago Socioeconomic Indicator Data Added to Our Library
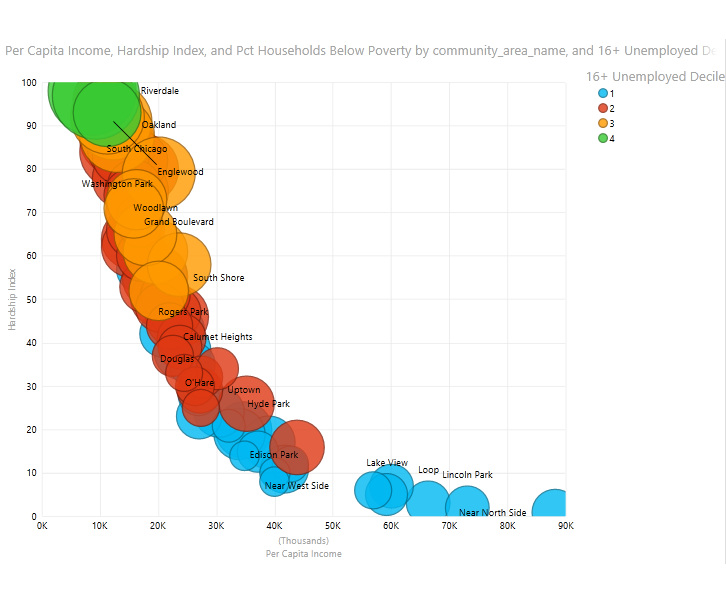
The above bubble chart graphs Chicago socioeconomic factors by Community Area. You can see that as Per Capita Income rises the Hardship Index decreases, the percentage of households below poverty decreases, and unemployment decreases. Would you like to build interactive charts and reports using this data? Now you can!
The City of Chicago’s open data portal includes a data set for Census Data – Selected socioeconomic indicators in Chicago, 2007 – 2011. The most granular level of the data set is for Community Area Number, which allows for other Chicago data sets to be mashed up with this census data.
For example, a while back we featured the Chicago open data set for crime. Tying these two data sets together results in the ability to compare crime activity, with parameters, versus community area census information such as unemployment, poverty, and hardship. We will post a mashup of these data sets later this week.
For now, if you’d like to integrate the Chicago Socioeconomic Indicators data into your own solution, we have posted data modeling instructions that can be found by clicking here.