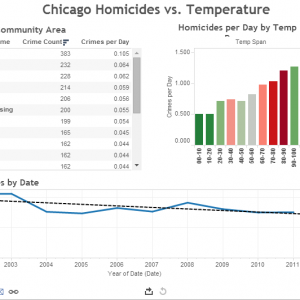
Visualizing the Relationships between Chicago Homicides and Hot Weather
The media frequently speculates about the relationship between hot summer weather and murders in Chicago. With both Chicago crime and daily weather information available to the public as open data,…
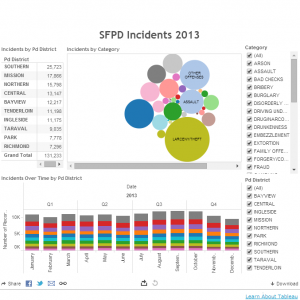
An Interactive Data Visualization Dashboard of San Francisco Police Reports in 2013
San Francisco Police Reports 2013 Dashboard (click the filter values and hover over bubbles and bar graph colors, it's interactive!) Learn About Tableau The above dashboard visualizes San Francisco Police…
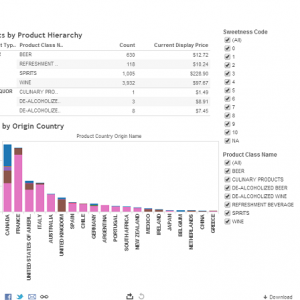
A Web Based Interactive Dashboard Using Tableau Public
BC Liquor Store Product Price List Dashboard It's a live interactive dashboard, give it a try! Learn About Tableau Yesterday I posted an article detailing the use of a liquor…


