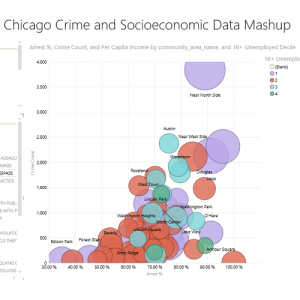
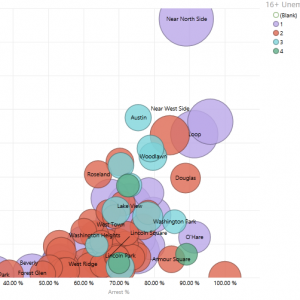
Video Tutorial on Scatter Charts for Data Visualization
Earlier this month I posted an article reviewing the basic principles of scatter charts for data visualization. The article received quite a few hits and links, so I went ahead…
Understanding and Using Scatter Charts – One of the Most Powerful Data Visualization Tools
Bar charts, line charts, and pie charts are the staple data visualization tools that most people use to present and consume data. If you've ever explored the chart types in…


