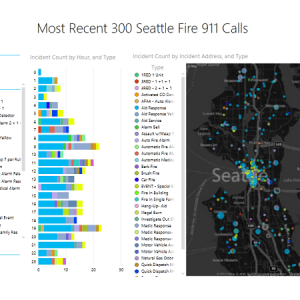
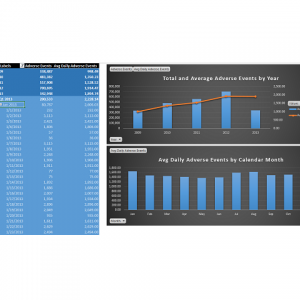
Seattle Real Time Fire 911 Calls API Data pulled into Excel for analysis using Microsoft BI tools Power Pivot, Power Query, & Power View
The above video walks through the process by which to use an API to pull data into Excel from a real time database of public information. Note that the database,…
Liquor Open Data from British Columbia’s DataBC Platform and BC Liquor Stores
Need a break from browsing accounting ledger open data? Take an hour to browse the BC Liquor Store Product Price list which is available on British Columbia's DataBC open data…
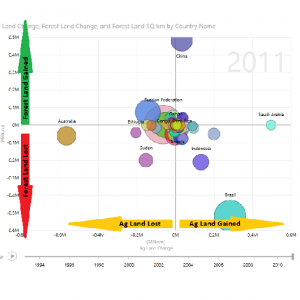
World Bank Forest and Agricultural Data Mashed Up to Visualize Trends
The World Bank provides open data about development in countries across the globe including data about agricultural land and forest area by country over time. Combining both of these data…
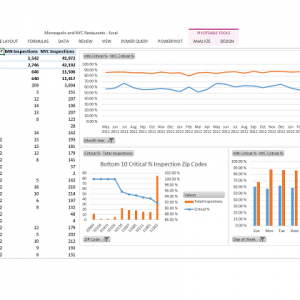
Mash Up Minneapolis and New York City Restaurant Inspection Data
The City of Minneapolis has made restaurant inspection data available to the public as open data. A useful example of how this data can be used and exposed to the…
Video Tutorial on Scatter Charts for Data Visualization
Earlier this month I posted an article reviewing the basic principles of scatter charts for data visualization. The article received quite a few hits and links, so I went ahead…
Pull openFDA API Data into a Pivot Table using Microsoft Excel
The United States Food and Drug Administration has launched a new open data site called openFDA. The site is currently in Beta testing, and provides API access to over 3…
Understanding and Using Scatter Charts – One of the Most Powerful Data Visualization Tools
Bar charts, line charts, and pie charts are the staple data visualization tools that most people use to present and consume data. If you've ever explored the chart types in…
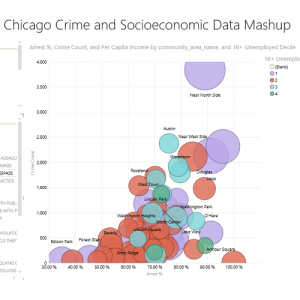
Combine Chicago Crime Data with Census Data for New Insights
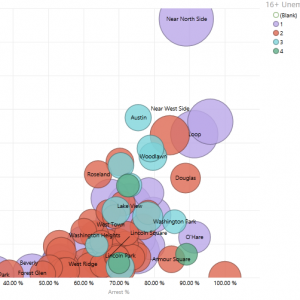
The City of Chicago provides access to crime data through their open data portal. Another data set at their portal, which originates from an entirely different source, is for census…
Video Tutorial to Unpivot Data Columns to Rows Using Excel with Power Query
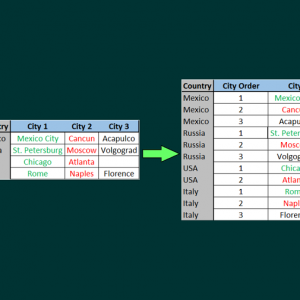
Quite often, data sets will store similar or identical attributes in columns instead of rows. When mashing up data or analyzing data using business intelligence tools, keeping data in rows…
Chicago Socioeconomic Indicator Data Added to Our Library
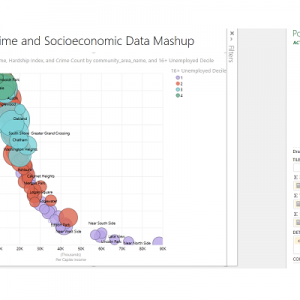
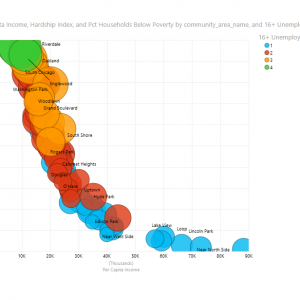
The above bubble chart graphs Chicago socioeconomic factors by Community Area. You can see that as Per Capita Income rises the Hardship Index decreases, the percentage of households below poverty…

