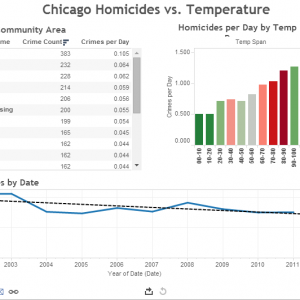
Visualizing the Relationships between Chicago Homicides and Hot Weather
The media frequently speculates about the relationship between hot summer weather and murders in Chicago. With both Chicago crime and daily weather information available to the public as open data,…
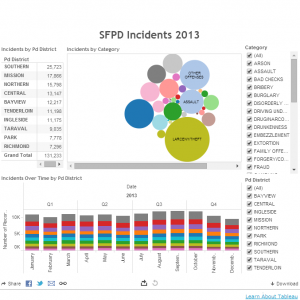
An Interactive Data Visualization Dashboard of San Francisco Police Reports in 2013
San Francisco Police Reports 2013 Dashboard (click the filter values and hover over bubbles and bar graph colors, it's interactive!) Learn About Tableau The above dashboard visualizes San Francisco Police…
Video Tutorial on Scatter Charts for Data Visualization
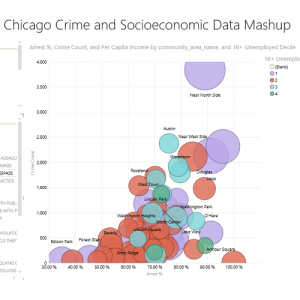
Earlier this month I posted an article reviewing the basic principles of scatter charts for data visualization. The article received quite a few hits and links, so I went ahead…
Understanding and Using Scatter Charts – One of the Most Powerful Data Visualization Tools
Bar charts, line charts, and pie charts are the staple data visualization tools that most people use to present and consume data. If you've ever explored the chart types in…


