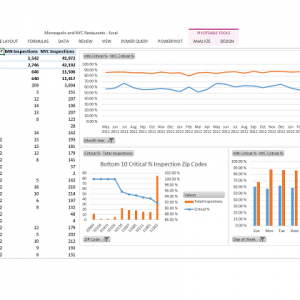
Mash Up Minneapolis and New York City Restaurant Inspection Data
The City of Minneapolis has made restaurant inspection data available to the public as open data. A useful example of how this data can be used and exposed to the…
Video Tutorial on Scatter Charts for Data Visualization
Earlier this month I posted an article reviewing the basic principles of scatter charts for data visualization. The article received quite a few hits and links, so I went ahead…
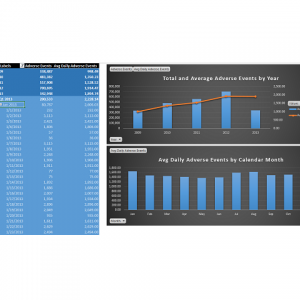
Pull openFDA API Data into a Pivot Table using Microsoft Excel
The United States Food and Drug Administration has launched a new open data site called openFDA. The site is currently in Beta testing, and provides API access to over 3…
Understanding and Using Scatter Charts – One of the Most Powerful Data Visualization Tools
Bar charts, line charts, and pie charts are the staple data visualization tools that most people use to present and consume data. If you've ever explored the chart types in…
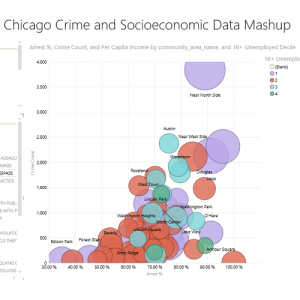
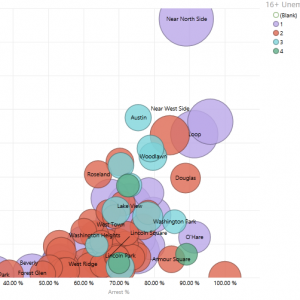
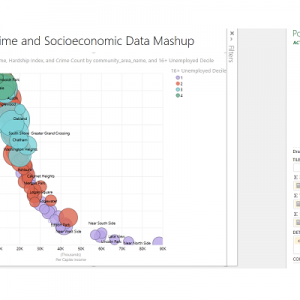
Combine Chicago Crime Data with Census Data for New Insights
The City of Chicago provides access to crime data through their open data portal. Another data set at their portal, which originates from an entirely different source, is for census…

