WhiteHouse.gov Office of Management and Budget Data Visualization
The United States Office of Management and Budget (OMB) has provided budgetary open data for public use that is accessible through WhiteHouse.gov and Data.gov. The data set covers 40 years of history going back to 1976. One of the great benefits of modern software is that anyone with a laptop and a basic business intelligence tool such as Excel can now access, model, and create interactive dashboard reports with this data. This article will feature the creation of a data model and dashboard report using open data from the OMB’s Public Budget Database.
UPDATE: This data set has a new documentation page that is designed to provide a step-by-step guide for integration into a business intelligence solution. Click here to visit that new page.
Accessing the Data
The OMB’s Public Budget Database can be obtained as either an Excel file or .csv file at the following link:
Documentation regarding the data can be obtained from the following link:
http://www.whitehouse.gov/sites/default/files/omb/budget/fy2012/assets/db_guide.pdf
Modeling the Data
The data is provided in the form of a normalized .csv flat file or .xls spreadsheet. For the examples in this article, the data was pulled into Excel 2013 using Power Query. Power Query was also used to “unpivot” columns for different years in order to transform the data into a format that is more suited to dimensional modeling and interactive reporting.
Date Dimension
The years specified for the data are US fiscal years, which differ from calendar years. Beginning in 1977, fiscal years are October 1 through September 30 of the next calendar year. So fiscal year 1980 would be 10/1/1979 through 9/30/1980. A derived column was added to the data model so that there is a key for the first day of each fiscal year. This can be used as a foreign key to reference the Open Data Bits Date Dimension.
Once designed to integrate with the Open Data Bits Date Dimension, the OMB’s Public Budget Database can be added to the Open Data Bits Logical Model as follows:
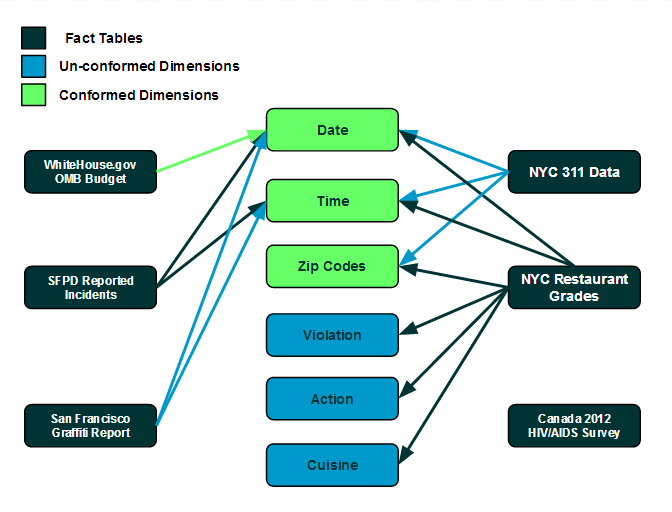
The page devoted to the Open Data Bits Logical Model can be accessed at this link.
Metrics
The primary metric for the data is named [Amt Total] in the reports built for this article. Another dynamic metric for year-over-year growth percentage ([YOY Growth %]) was added to the model, too.
Documentation regarding sources, the conformed model, and metrics from Open Data Bits can be accessed at this link.
Visualizing the Data
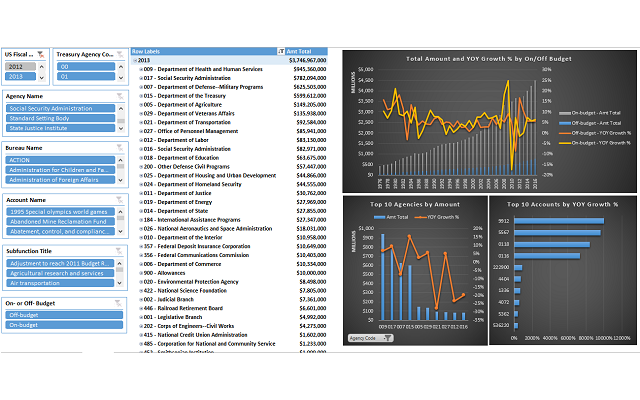
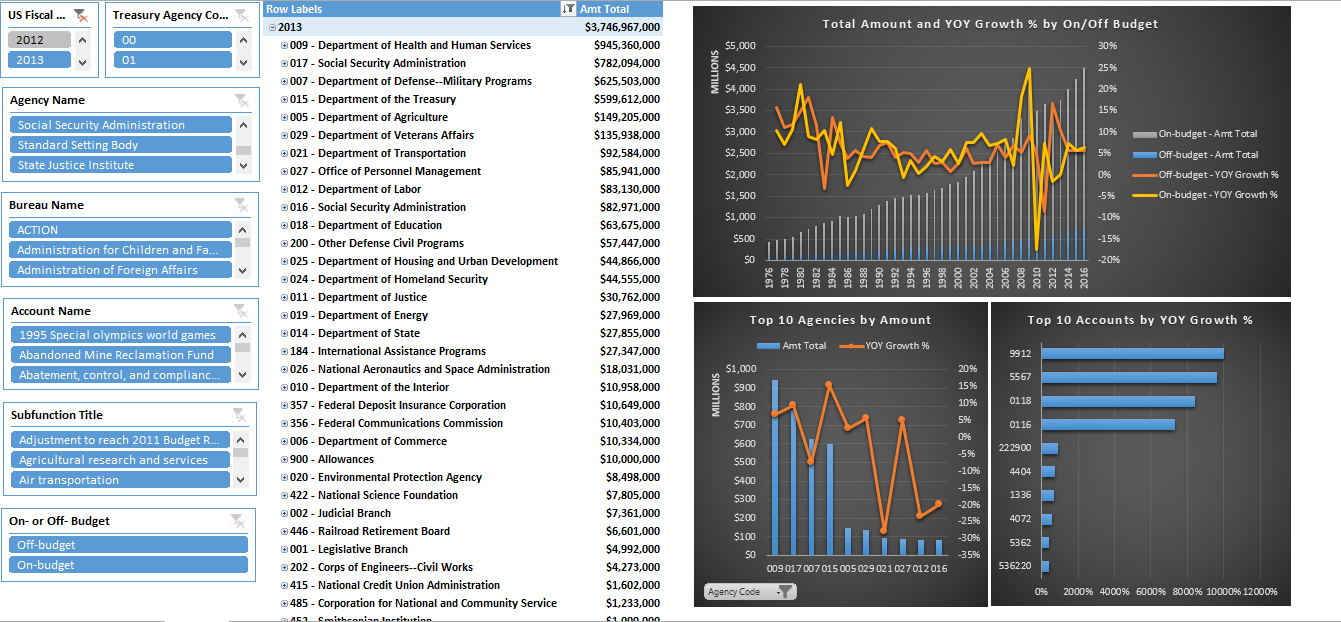
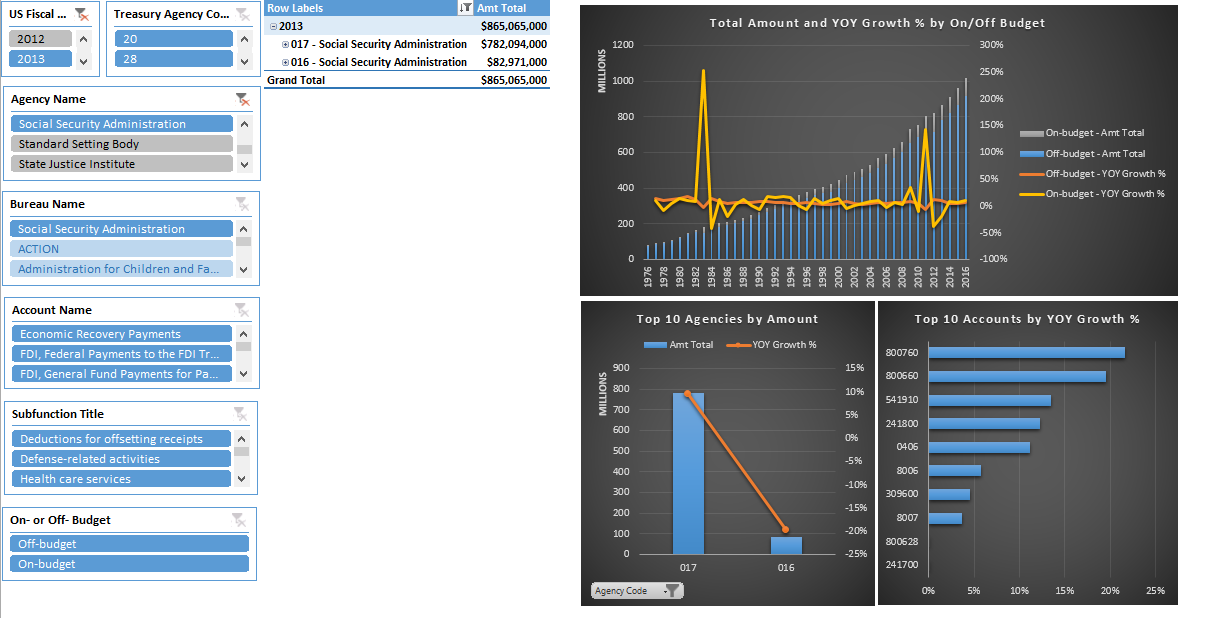
The OMB’s Public Budget Database open data was accessed, modeled, and visualized using Excel 2013 with Power Query and Power Pivot. The data can be displayed on an interactive dashboard using slicers, pivot tables, and pivot charts. The [US Fiscal Year] slicer is selected for member “2013” which filters all report parts except the historical trend chart:
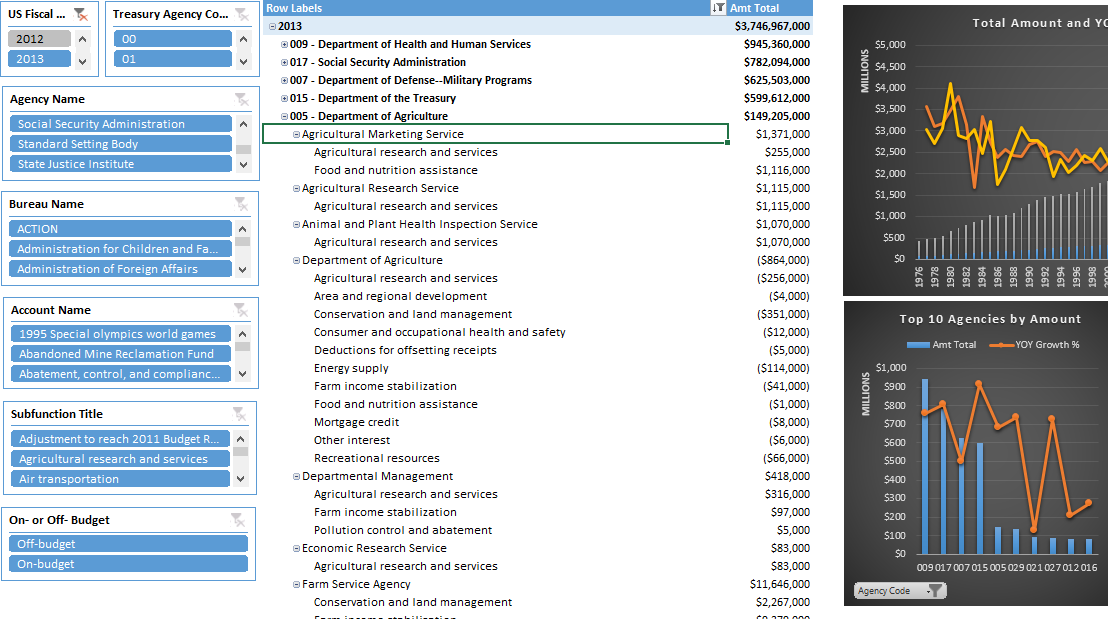
Notice the “expand” buttons next to the [Agency] members on the pivot table? They can be opened to drill down within an Agency to a lower level of detail. The example below expands down to show values by [Bureau Name] and [Subfunction Title] within the [Agency] “005 – Department of Agriculture”:
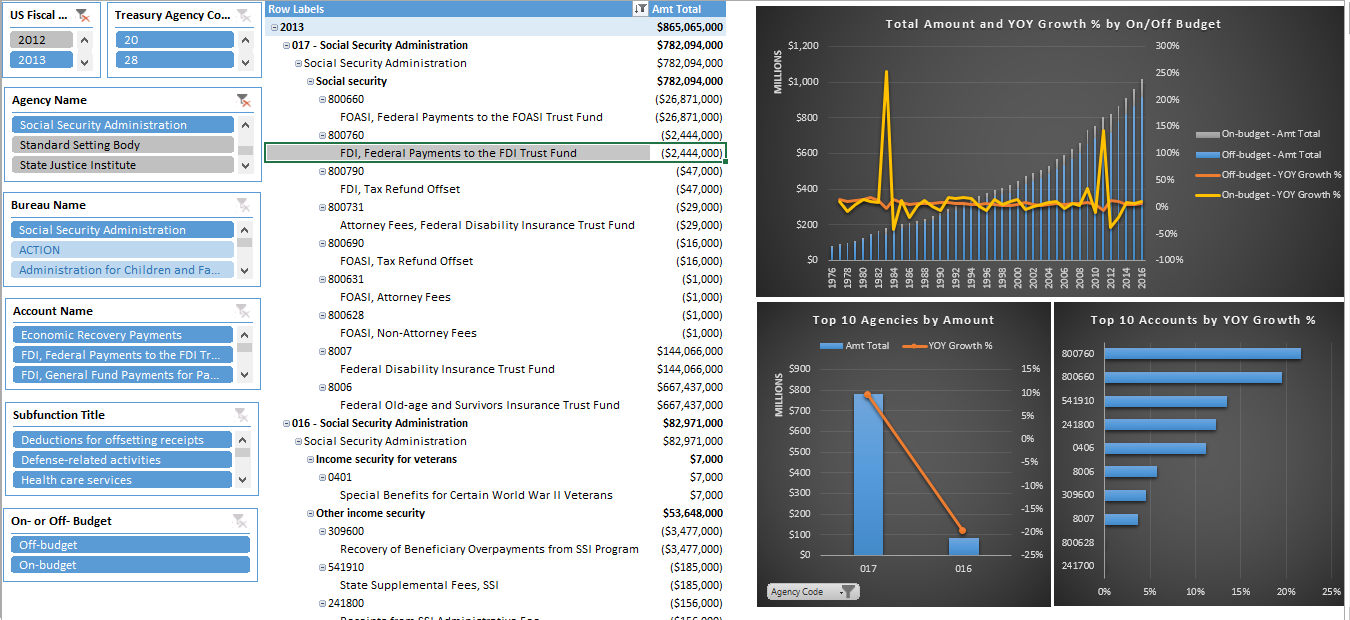
Selecting only the [Agency Name] slicer for member “Social Security Administration” filters all of the parts of the report for tables and charts specific to data from that category:
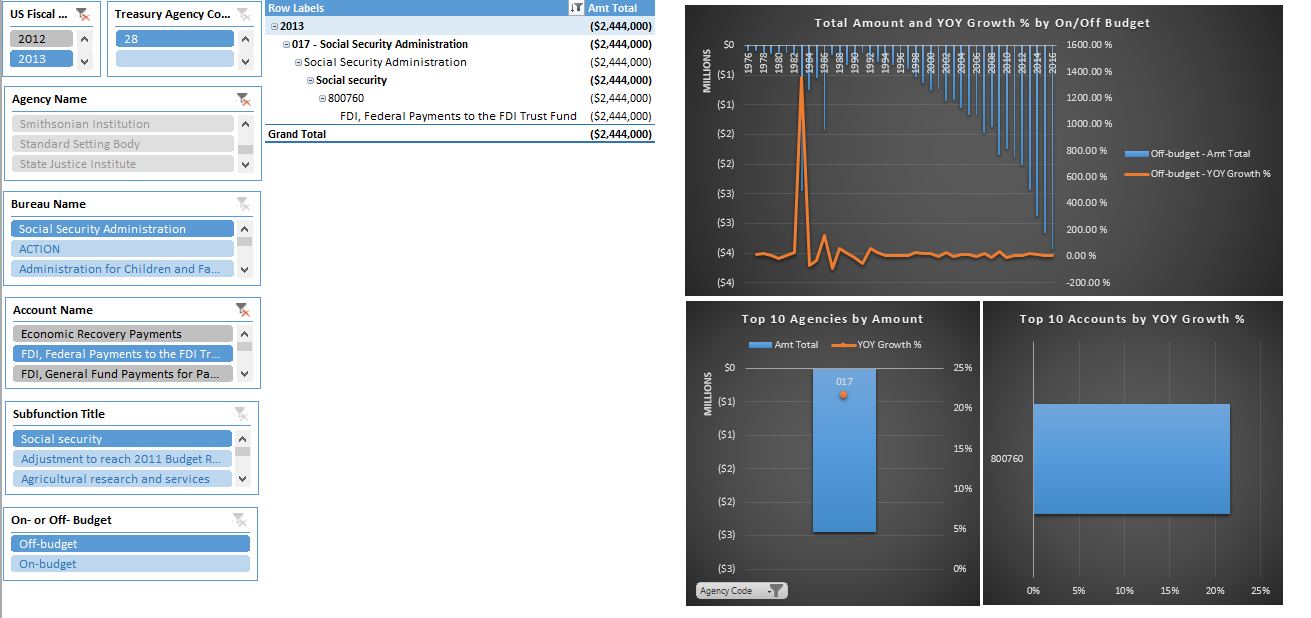
Using the pivot table expand feature enables a user to determine the specific values for Account “800760 FDI, Federal Payments to the FDI Trust Fund,” which had the largest YOY Change %:
Finally, the Account “800760 FDI, Federal Payments to the FDI Trust Fund” can be selected in the slicer to give charts specific to data for Fiscal Year 2013, mapped to the Social Security Administration, and unique to that Account:
Once the data model exists in a tool such as Power Pivot, new interactive business intelligence reports such as these can be built in a matter of hours.
Feedback and suggestions are welcome in the comments of this article or via the Open Data Bits Feedback Page.