San Francisco Police Department Reported Incidents Open Data

The city of San Francisco has made a wealth of data available for public use via an open data website. One of the many robust and useful data sets is sourced from the San Francisco Police Department and contains details about reported incidents spanning back to 2003. This article will discuss modeling, integrating, and visualizing San Francisco Police Department Reported Incidents open data.
UPDATE: This data set has a new documentation page that is designed to provide a step-by-step guide for integration into a business intelligence solution. Click here to visit that new page.
Accessing the Data
The SFPD Reported Incidents open data can be accessed from the following web page:
https://data.sfgov.org/Public-Safety/SFPD-Reported-Incidents-2003-to-Present/dyj4-n68b
The page contains general information about the data, along with a link to download a zip file containing a separate .csv zip file for each year of data going back to 2003. For the screenshots in this article the zip file was downloaded manually, extracted, and integrated into Power Pivot for Excel 2013.
Modeling the Data
Each year of data is available in a normalized .csv table. The columns are the same for each year, so all of the tables could be united with a SQL “Union All” statement or the equivalent in another tool. There are a few useful attributes such as date, time, police district, and latitude/longitude.
Date and Time Dimensions
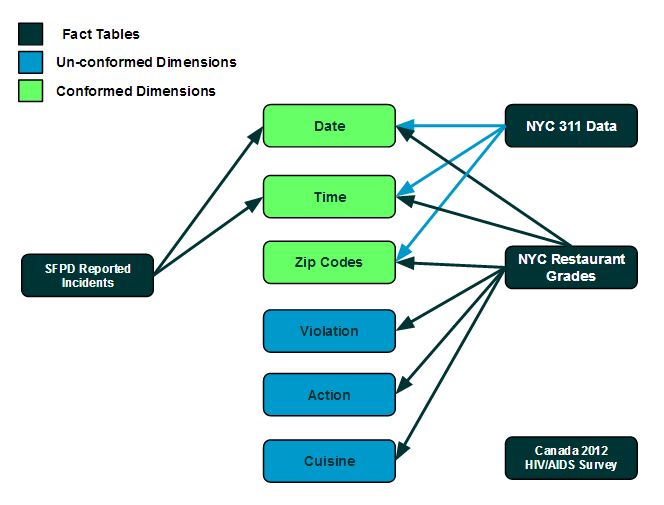
The SFPD Reported Incidents data contains columns for both [Date] and [Time]. The [Date] column can be used directly as a foreign key to reference the Open Data Bits Date Dimension. The SFPD Reported Incidents [Time] column does not contain “seconds,” but with a slight transformation can be used as a foreign key to reference the Open Data Bits Time Dimension.
The SFPD Reported Incidents data model can now be integrated with the existing Open Data Bits model:
The current Open Data Bits logical model (updates will happen with future posts) can be found at this link.
Hierarchies
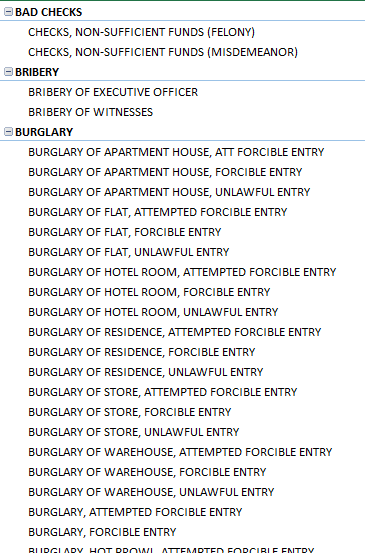
The only hierarchy that was added to the solution was for [Category] > [Description]. It appears that [Description] is a child member of [Category]:
The only metric that was added to the solution was Incident Count, which is intended to represent a count of incidents based upon counting the rows in the source data.
Details about the Source, Modeling, Hierarchies and Metrics can be found at this Open Data Bits page by filtering for “SFPD Reported Incidents.”
Visualizing the Data
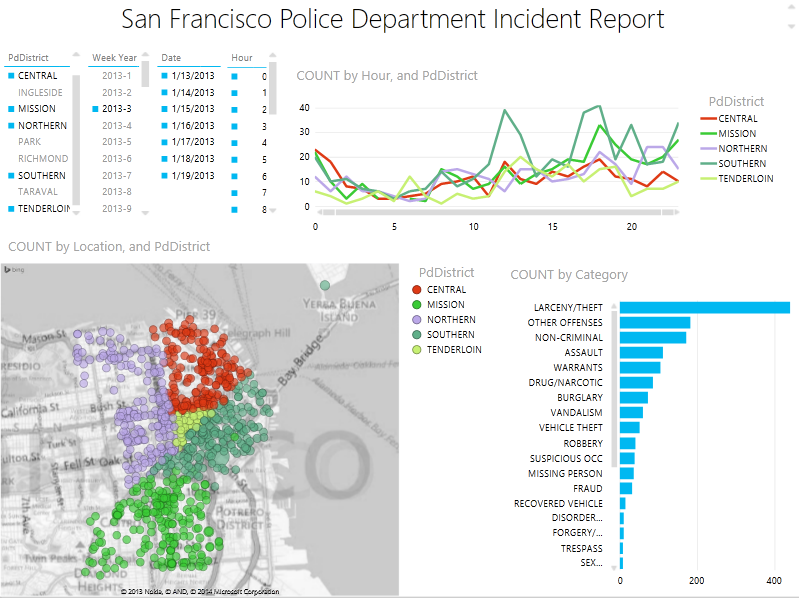
Power Pivot for Excel 2013 was used to create a data model for the SFPD Reported Incidents data. The visualizations were then created using Power View.
From a high level, data can be visualized for the specific [PdDistricts] Central, Mission, Northern, Southern, and Tenderloin. These members have been selected in the slicer in the upper left of the page. There are also interactive slicers for Week of the Year (week 3 of 2013 is selected), Date, and Hour of the Day. The top line graph shows incidents by hour of the day, by [PdDistrict]. The bar chart shows incidents by [Category], and the map plots a count of incidents at each [Location] as mapped using [Latitude] and [Longitude]:
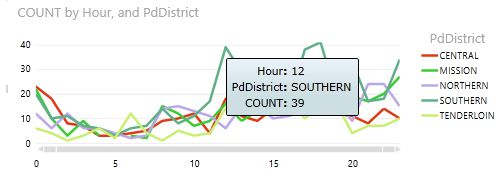
Next, hovering over a line spike shows that there were 12 incidents that week in the [PdDistrict] “Southern” during the noon hour:
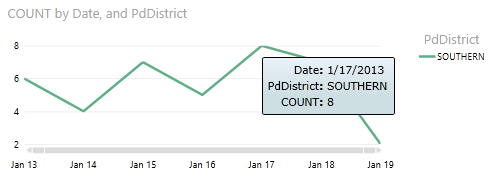
Selecting only “Southern” in the [PdDistrict] slicer reveals the days upon which these incidents occurred. Eight of them happened on 1/17/2013:
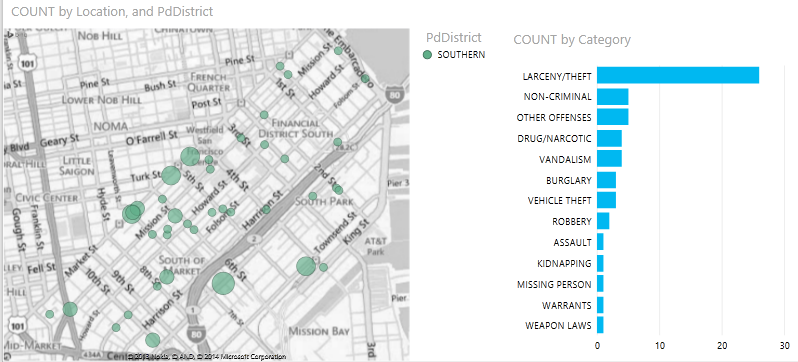
Selecting 1/17/2013 in the slicer, the locations and types of [Category] can be viewed for 1/17/2013:
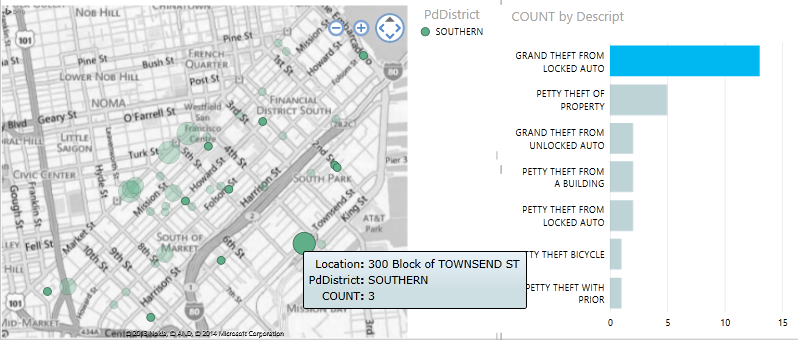
Drilling into the bar chart for “Larceny/Theft,” and then clicking on “Grand Theft From Locked Auto” filters the map for the [Location] and count of incidents:
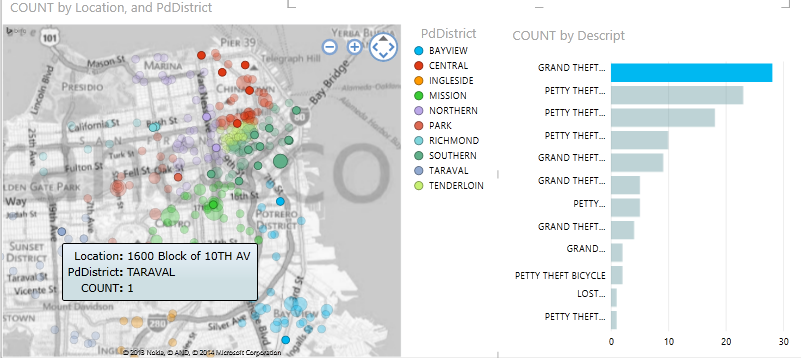
Selecting all members of the [PdDistrict] slicer then shows the [Description] “Grand Theft From Locked Auto” for all members of [PdDistrict]:
As always, feedback and suggestions are always welcome and will enable continuous improvement for Open Data Bits. Our next featured open data set will be for Graffiti Reports in San Francisco, so stay tuned.