San Francisco Graffiti Reports Open Data
The city of San Francisco has numerous data sets available to the public, including data that details reports about graffiti in the city. This article will model, integrate, and visualize the data as a new addition to the Open Data Bits conformed data model.
UPDATE: This data set has a new documentation page that is designed to provide a step-by-step guide for integration into a business intelligence solution. Click here to visit that new page.
Accessing the Data
San Francisco’s graffiti data can be accessed at the following web page:
https://data.sfgov.org/Service-Requests-311-/Graffiti-SF311-Reports/vyt7-q4b9
The page is in a user-friendly Socrata format containing discussions, links to other views, and different formats for accessing the data.
Modeling the Data
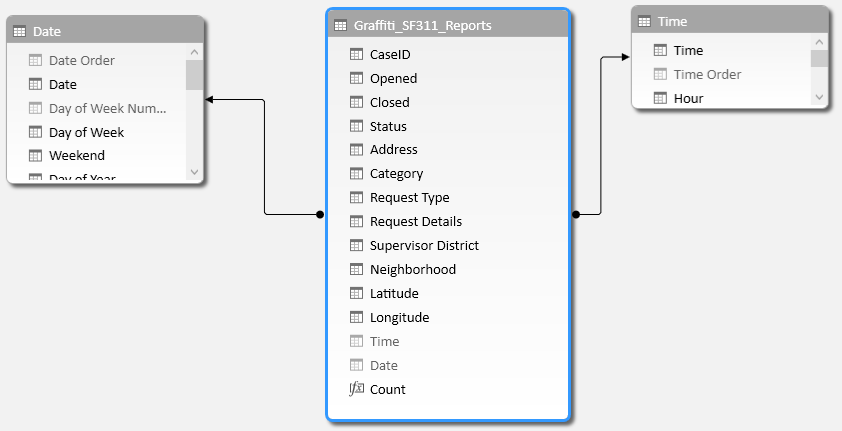
The San Francisco Graffiti data is sourced as a normalized table containing several attributes. The column [Opened] contains date and time information that can be derived into a date and time column to reference the Open Data Bits Date and Time dimensions.
As a result of adding conformed Date and Time dimensions to the San Francisco Graffiti data model, the updated Open Data Bits logical model containing all of the open data that we have featured looks as follows:
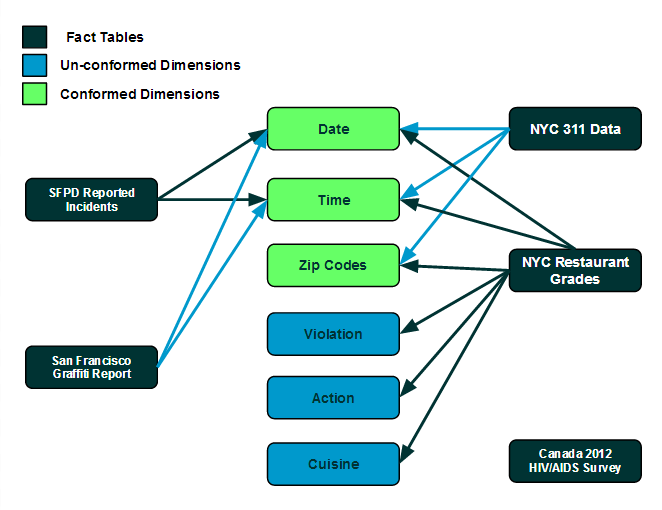
A copy of the current Open Data Bits Logical Model (it will change with the future addition of new data sets) can be viewed at this page.
Hierarchies
There are no apparent natural hierarchies in the San Francisco open data set.
Metrics
The only metric added to the Open Data Bits example solution is for [Graffiti Count], which represents a count of rows in the data. Theoretically, this should represent a count of graffiti reports.
Visualizing the Data
Once the San Francisco Graffiti Reports open data has been modeled, business intelligence tools can be used to visualize the data. For the example below, the solution was built in Power Pivot and is displayed using Power View for Excel 2013. Here’s a screenshot of the solution in Power Pivot:
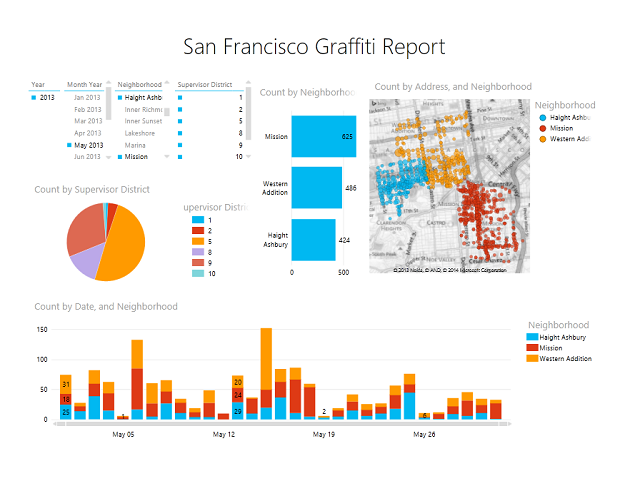
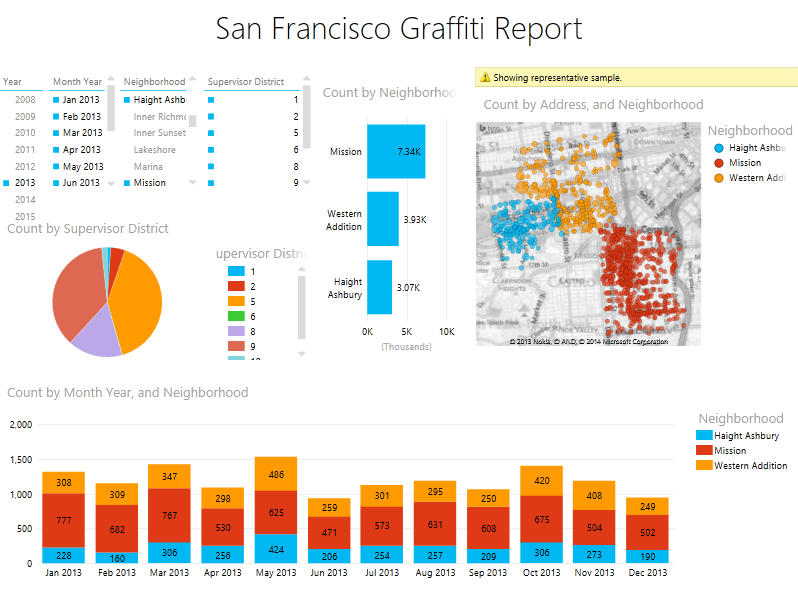
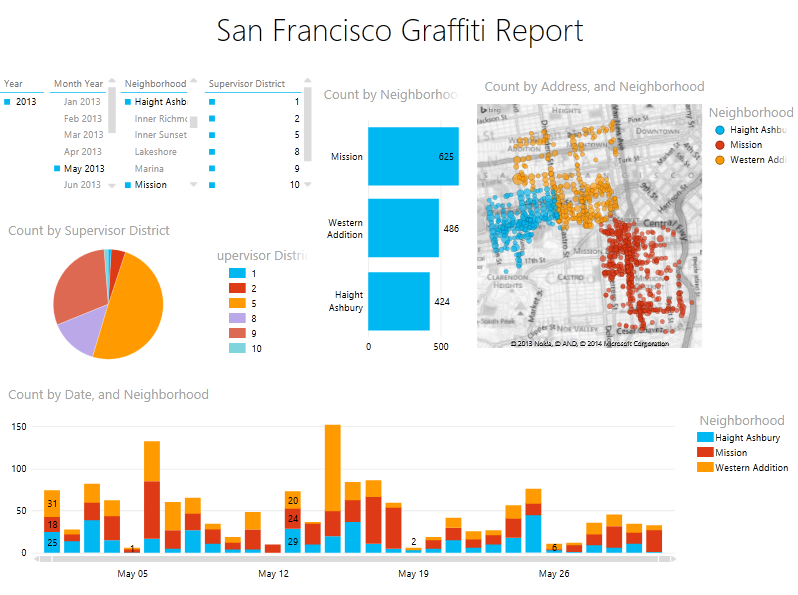
Starting out filtered for 2013 and the [Neighborhood] values of “Mission,” “Western Addition,” and “Haight Ashbury” the San Francisco Graffiti open data can be visualized as shown below. Slicers for [Year], [Month Year], [Neighborhood] and [Supervisor District] filter the interactive charts. The upper right map shows reports by [Neighborhood], the pie chart shows reports by [Supervisor District], and the bar chart at the bottom visualizes reports by [Neighborhood] and month:
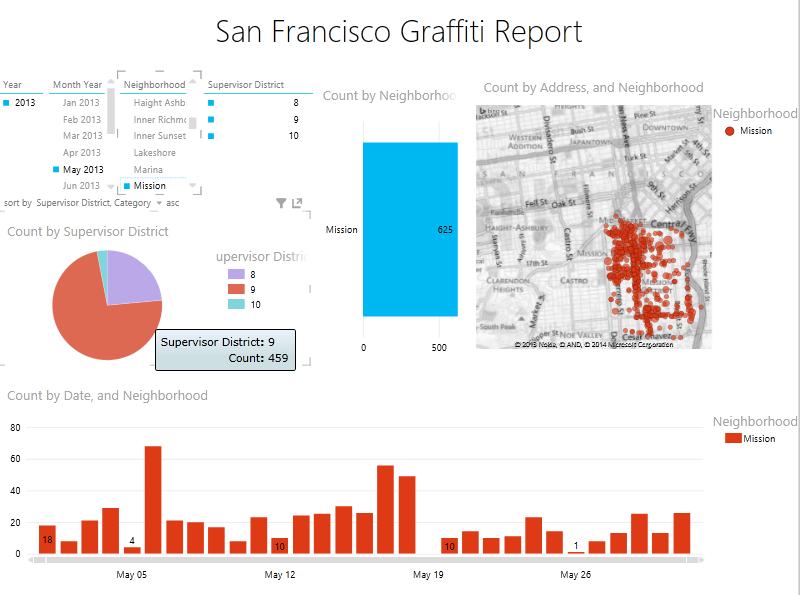
Selecting “May 2013” in the slicer and drilling into the bar chart shows the reports in May 2013 by day:
Selecting only the [Neighborhood] slicer for “Mission” reveals that most of the reports there map to [Supervisor District] member “9”:
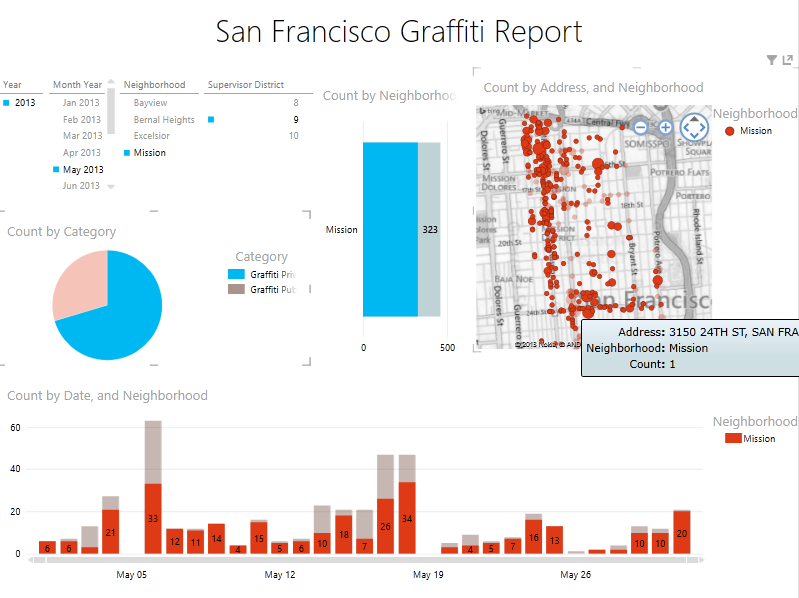
Selecting only [Supervisor District] member “9” in the slicer, and drilling into the pie chart to show [Category] “Graffiti Private Property” shows that most of the reports fell along two streets on the map, including 24th Street:
As always, feedback and suggestions are welcome and will make Open Data Bits better. The next Open Data Bits post will mash up the San Francisco Graffiti Reports with the SFPD Reported Incidents open data that was featured a few days ago.