NYC Restaurant Inspections Results Open Data
The first open data set featured at Open Data Bits was NYC 311 Service Requests, which can be read by clicking here. New York City also has Restaurant Inspection Results data available for use as open data, and in this article we have mashed it up with the 311 Service Requests data model that we had previously created.
UPDATE: This data set has a new documentation page that is designed to provide a step-by-step guide for integration into a business intelligence solution. Click here to visit the new page for NYC Restaurant data, and click here for the new page on NYC 311 Service Request data.
Accessing the Data
New York City’s Restaurant Inspections Results open data can be accessed from the following link:
https://nycopendata.socrata.com/Health/Restaurant-Inspection-Results/4vkw-7nck?
The page contains details about NYC Restaurant Inspections Results, along with a link to a zip file containing the open data. The zip file contains .txt files having data in a comma delimited format. For this demonstration, the zip file was downloaded and the files within it were extracted and transformed using Power Pivot for Excel 2013. Tools frequently used for ETL and data visualization by Open Data Bits are detailed at this page.
Modeling the Data
The NYC Restaurant Inspections Results zip file contains 4 text files. Open Data Bits documentation for this data set can be found at this page when filtering for the source “NYC Restaurant Grades.” The files in the zip file are:
- WebExtract – This file functions primarily as a fact table, but also contains attributes and detail information. A few examples include Zip Code, Inspection Date, Score, and Current Grade.
- Action – Codes for actions along with descriptions are contained in this file. By filtering for rows with an [ENDDATE] greater than 2010, the [ACTIONCODE] column will become a unique key for the table. The WebExtract table contains a column [ACTION] which can be used as a foreign key to reference the Action table.
- Cuisine – Details for cuisine types are in this file along with a column [CUISINECODE] which is a primary key for the table. The WebExtract table contains a column [CUISINECODE] which can be used as a foreign key to reference the Cuisine table.
- Violation – Violation specifics are on this table, and by filtering [ENDDATE] for dates greater than 2010 the column [VIOLATIONCODE] can be used as a unique primary key. WebExtract has a column named [VIOLCODE] that can be used as a foreign key to reference the Violation Table.
Both the NYC 311 Service Requests and NYC Restaurant Inspection Results open data sets contain zip code data. For the mashed-up data model, a conformed dimension for Zip Codes has been added to enable interoperability between the data sets for comparative analysis by zip codes. An open data list of US states and zip codes is available at Data.gov, and was used as a source for the conformed Zip Codes Dimension. The file was downloaded as a .csv file, filtered for unique Zip Codes, and uploaded into Power Pivot. The column [ZIP Code] is used as a primary key for the column [Incident Zip] in NYC 311 Service Requests and [ZIPCODE] in the WebExtract table for NYC Restaurant Inspection Results.
In the previous Open Data Bits article featuring NYC 311 Service Requests, separate dimensions were created for Date and Time. The WebExtract table contains a column for [INSPDATE] that can be used to create derived columns functioning as foreign keys for the Date Dimension and Time Dimension.
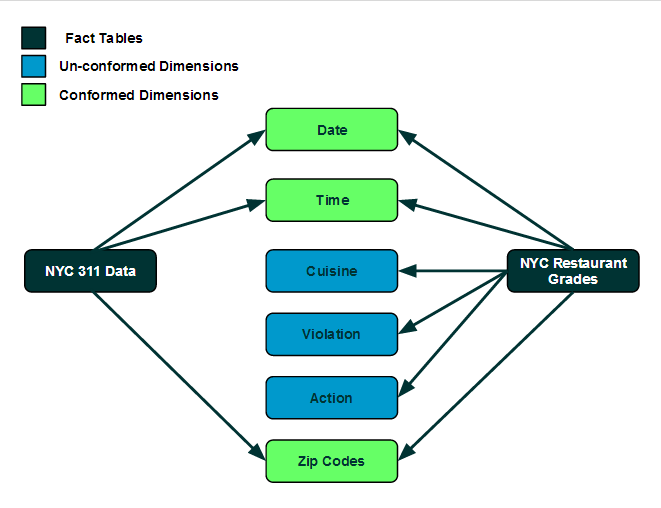
As a result of the above data modeling efforts, the high level logical model of the mash-up using NYC 311 Service Requests and NYC Restaurant Inspections Results open data looks as follows:
Hierarchies
While hierarchies may exist in the NYC Restaurant Inspection Results data, none were added for this demonstration. A hierarchy for [State] > [Zip Code] was added to the Zip Codes Dimension, but is not yet necessary since both data sets apply only to New York State.
Metrics
The following metrics were added for the NYC Restaurant Inspections Results open data set:
- Inspection Count – A count of rows for the WebExtract table. This is a count of unique entries in the data.
- Graded Count – A count of rows from the WebExtract table that have a value other than null for the [CURRENTGRADE] column.
- C Grades – Created for use in a visualization tool, this metric counts the number of rows for which the [CURRENTGRADE] is “C.”
- Score Avg – The average [SCORE] for rows that are not null.
- Score Max – The maximum [SCORE] for rows that are not null.
- Score Min – The minimum [SCORE] for rows that are not null.
Visualizing the Data
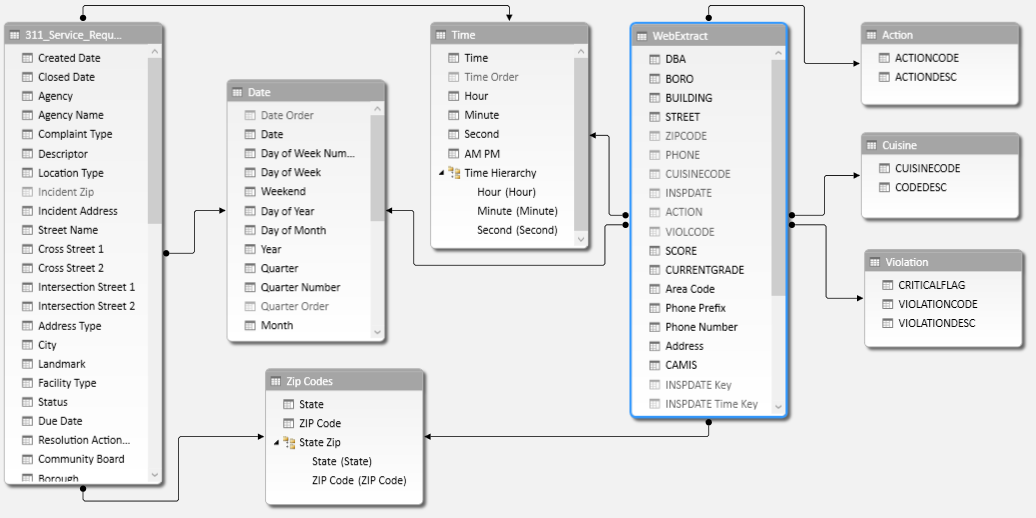
Once the NYC Restaurant Inspection Results data has been modeled and the metrics determined, it can be pulled into a reporting tool and mashed-up with the NYC 311 Service Requests Data. Open Data Bits has used Power Pivot for Excel 2013 to perform this task, and the data model looks as follows in the Power Pivot Diagram View:
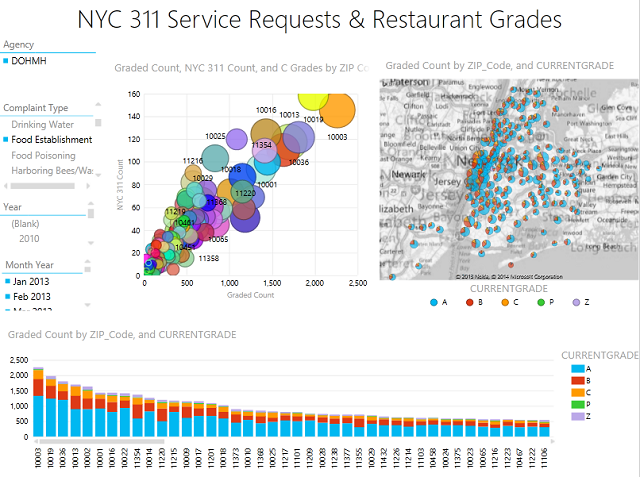
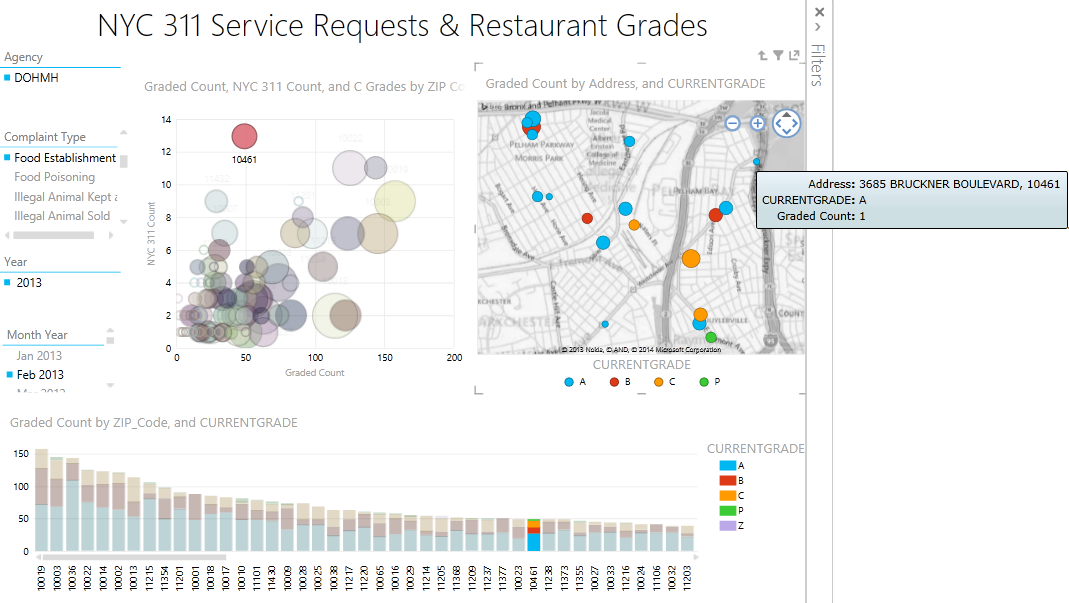
The data model can then be explored using Power View for Excel 2013. Starting with a Power View report filtered for both “DOHMC” from the NYC 311 Service Request attribute [Agency] and “Food Establishment” from [Complaint Type], data from both data sets can be visualized using interactive slicers. The slicers are on the left hand side. The bubble chart plots zip codes for a count of NYC 311 Service Requests on the y axis, a count of NYC Restaurant Inspection Results ([Graded Count]) that were graded on the x axis, and a count of “C” grades from NYC Restaurant Inspections determining the bubble size. The map displays zip codes by [Graded Count] and the value of [CURRENTGRADE]. The bar chart at the bottom shows the same data as the map, but in descending order of [Graded Count]:
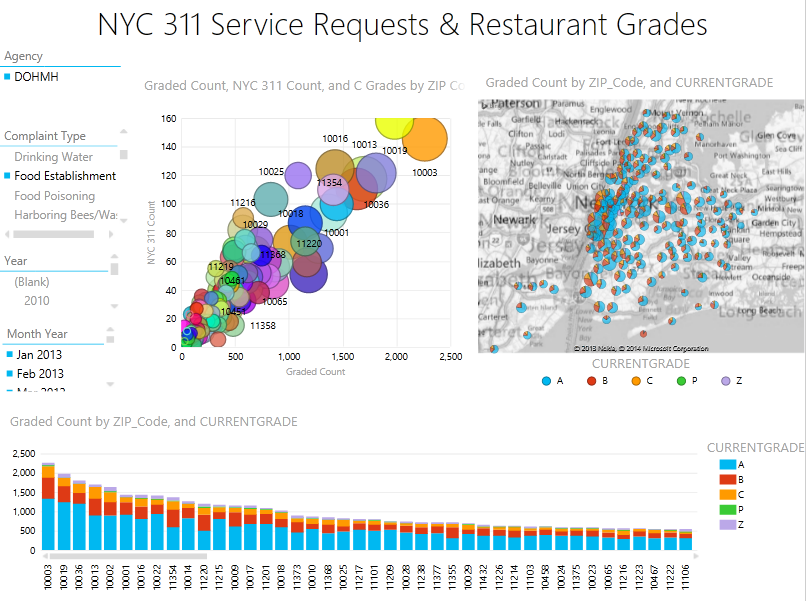
After filtering for February of 2013, there appears to be a high number of 311 Service Requests for zip code “10461” relative to [Graded Count] from the NYC Restaurant Inspection Results. Clicking on this bubble and then drilling into the “10461” zip code bubble on the map displays the addresses that were graded in that zip code:
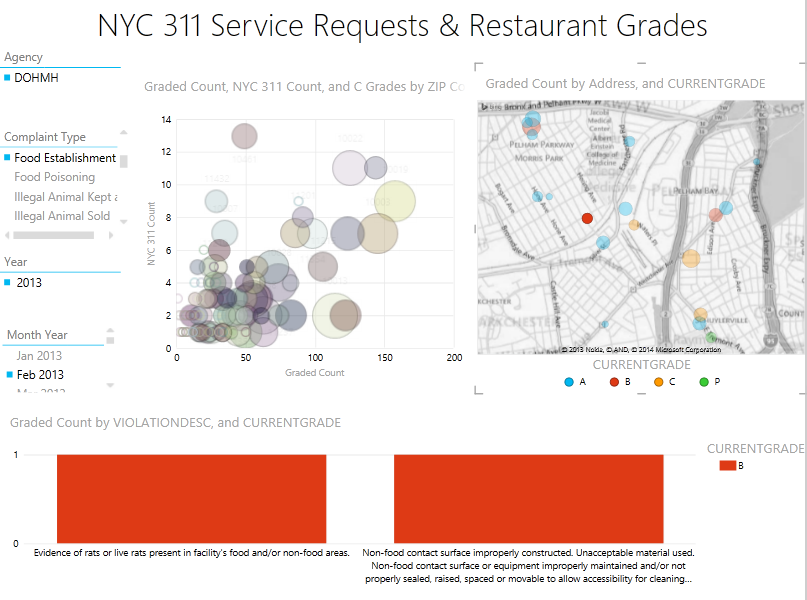
Finally, after drilling into the bottom bar chart, an individual address can be clicked on the map. Rows from the NYC 311 Service Requests Violations table can then be seen for February 2013, in that zip code, for that particular address:
Another open data set will be featured shortly, so in the meantime please provide any feedback or suggestions in the comments for this page. Advice is always welcome on our Feedback Page, too.