New York City 311 Service Requests Open Data
New York City has made open data available to “serve as a rich resource for developers, civic groups, and anyone else to build applications on their own.” One of those data sets contains data for 311 Service Requests from 2010 to Present. This data is very interesting to explore having attributes such as zip code, borough, latitude and longitude in addition to details about the requests.
Accessing the Data
New York City’s 311 Service Requests from 2010 to Present can be accessed from the following link:
https://nycopendata.socrata.com/Social-Services/311-Service-Requests-from-2010-to-Present/erm2-nwe9
The page contains several interactive features for discovering, discussing, and accessing the data. For the purpose of this article, data was pulled into Microsoft Excel 2013 using an OData connection. The connection was set up using the Excel 2013 add-in Power Query, and then added to the data model in Power Pivot. Instructions for using the OData url can be found at this link. There are numerous methods to access the data for NYC’s 311 Service Requests, and there are also several tools on the market that can be used to work with the data.
UPDATE: This data set has a new documentation page that is designed to provide a step-by-step guide for integration into a business intelligence solution. Click here to visit that new page.
Modeling the Data
Since this is the first data set featured at Open Data Bits, this article will not contain examples of mash-ups with other open data. Instead the focus will be on setting a foundation for conformation with other data sets in the future.
Date and Time Dimensions
First, a Date Dimension was created to enable both hierarchical rollups of data and interoperability with other data sets that have data that is at the day level or lower. A good overview of the need and general design of a Date Dimension can be found at this link.
Open Data Bits has created a custom Date Dimension that you can download from this link.
There are a few columns that include date values in the NYC 311 data including [Created Date], [Due Date], and [Closed Date]. Any of these columns could be the basis for a foreign key to the Date Dimension. We chose to feature [Created Date] for our examples. [Created Date] has both Date and Time components, so a derived column was created to drop the Time component from [Created Date]. As a result, the [Created Date] column can be derived to a column that is mapped to the Date Dimension at a granularity of the day level.
For the Time component of [Created Date], a similar approach was taken. This will allow both interoperability with future data sets and the ability for reports to interactively roll data up by second, minute, hour of the day and AM/PM.
Details about the Time Dimension used by Open Data Bits can be downloaded from this link.
The reason for splitting out the Date and Time dimensions separately is to reduce unnecessary row volumes in the conformed solution. There are 86,400 seconds in a day, which is the number of rows in the Time Dimension. If the Time and Date dimensions remained combined, there would be (86,400 x 365 = 31,536,000) rows per every year of data in the solution.
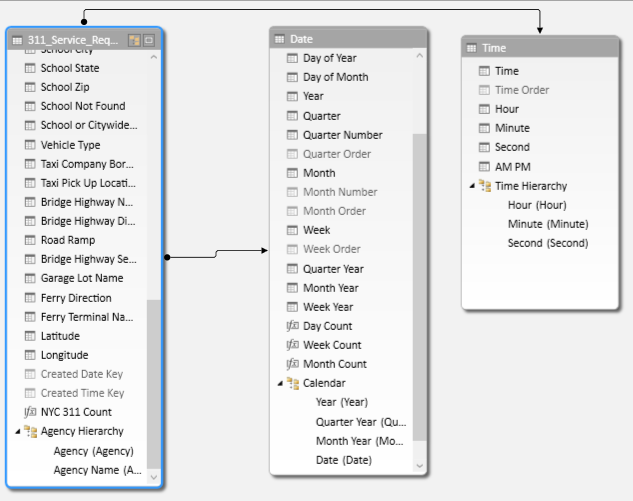
As a result, a high level Logical Model of the NYC 311 solution looks as follows:

Hierarchies
Hierarchies are logical relationships within data in which parent-child relationships exist. An example would be that Date is a child of Month, which in turn is a child of Quarter. More details about hierarchies are available at this link.
There does not appear to be any natural hierarchies that need to be called out when using the NYC 311 Service Requests data as a standalone source. There are some examples of natural geographic hierarchies, but since all of the data is for New York State there is not a need to build a hierarchy for these in the solution.
For reporting purposes, a hierarchy was created for [Agency] > [Agency Name]. It appears that some values for [Agency Name] roll up to [Agency]:
Documentation detailing the Open Data Bits sources, modeling, hierarchies, and measures of the NYC 311 Service Requests open data can be found at this page.
Metrics
The primary metric for this data set appears to be a count of service requests, which translates to a count of rows in the solution. Metrics from the Date Dimension such as [Day Count], [Week Count], and [Month Count] can also be used when exploring the data.
Visualizing the Data
Once the NYC 311 Service Request open data has been modeled with hierarchies and metrics, business intelligence tools can be used to visualize the data. For the example below, the solution was built in Power Pivot and is displayed using Excel 2013. Here’s a screenshot of the solution in Power Pivot:
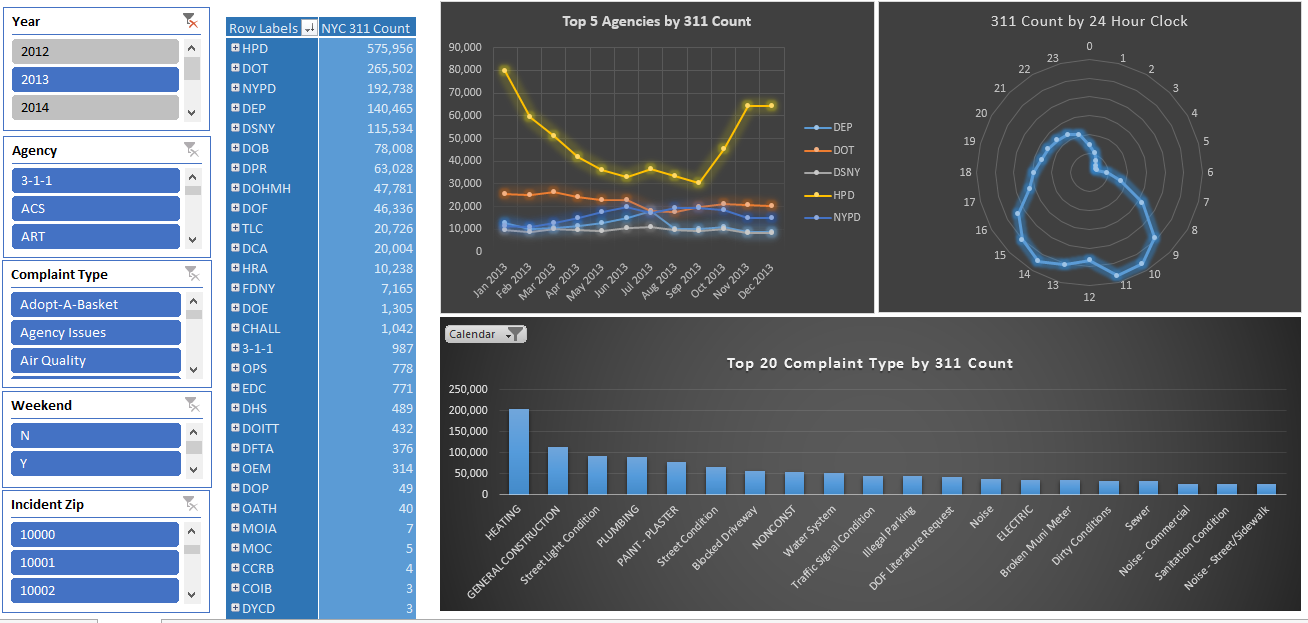
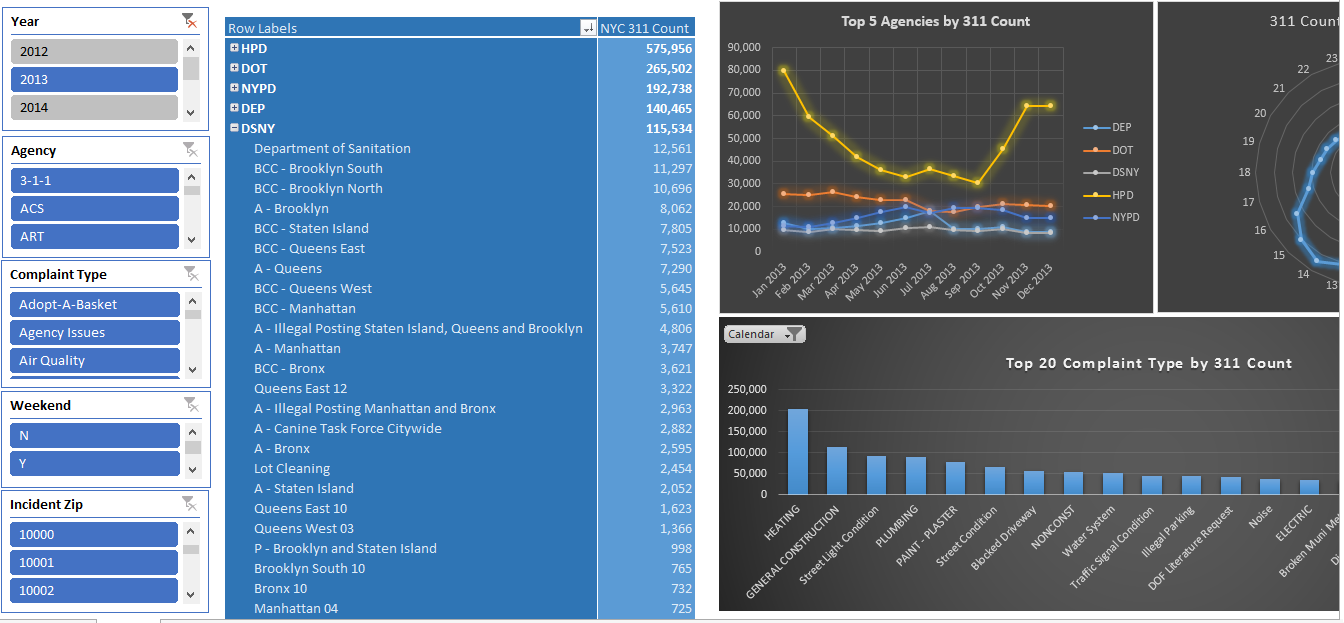
Starting with only a filter for the year 2013, a count of NYC Service Requests can be seen by Agency, by month, by hour of the day (24 hour clock), and by complaint type:
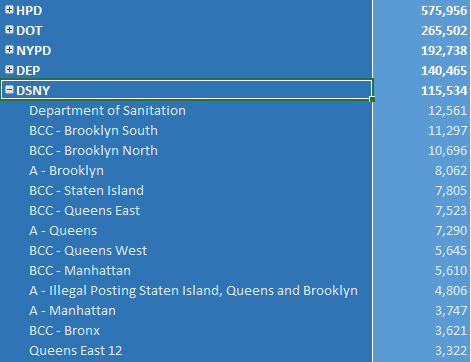
The hierarchy for the Agency member “DSNY” can be expanded to view the Agency Names within that Agency in descending order of service requests:
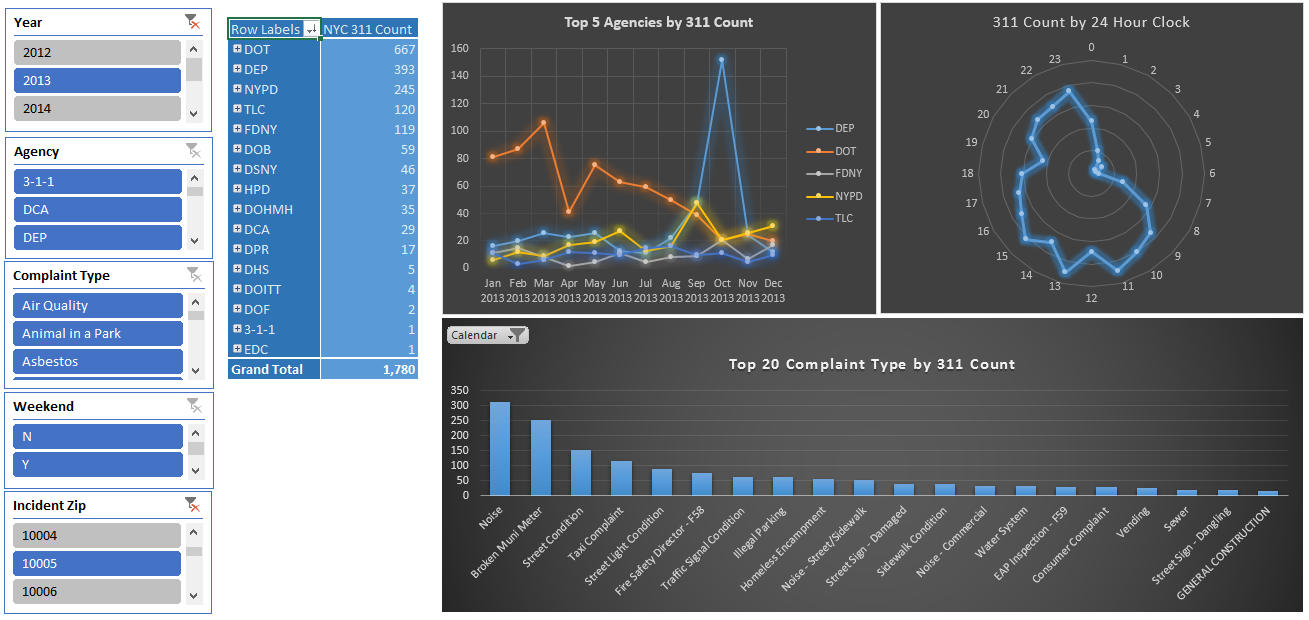
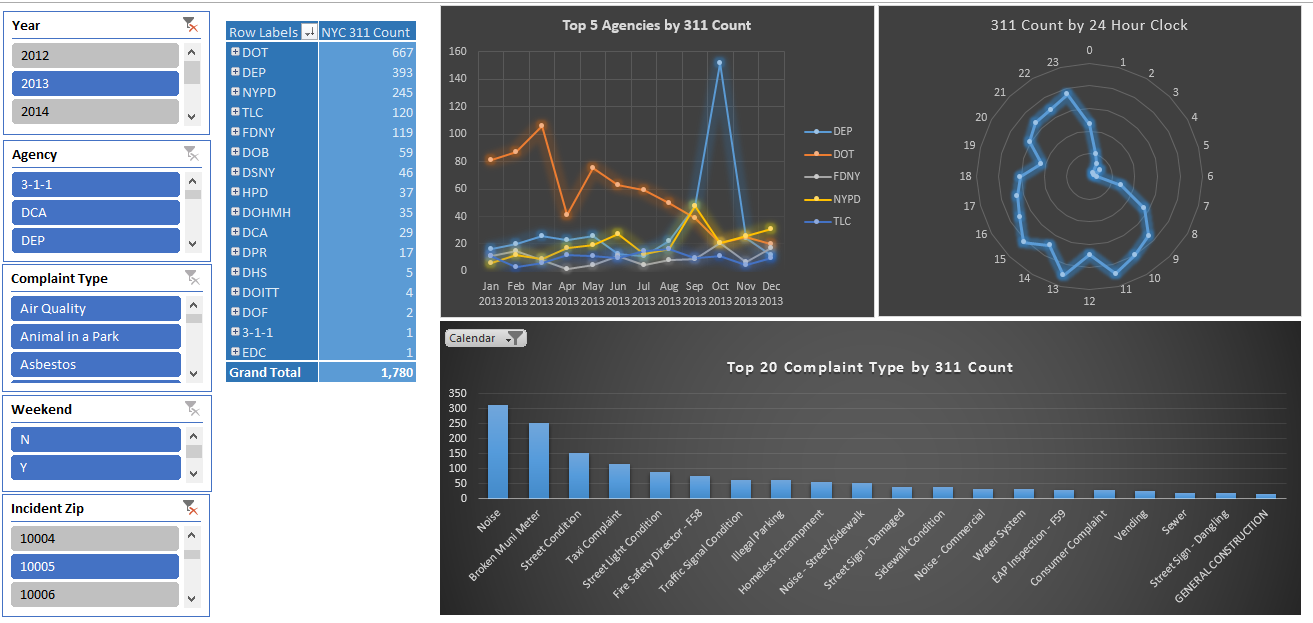
Filtering the report for Incident Zip of 10005 (near Wall Street) using the slicer on the bottom left, the charts show data for that location only. It appears that there was a spike in 311 Service Requests to the Agency “DEP” in October of 2013:
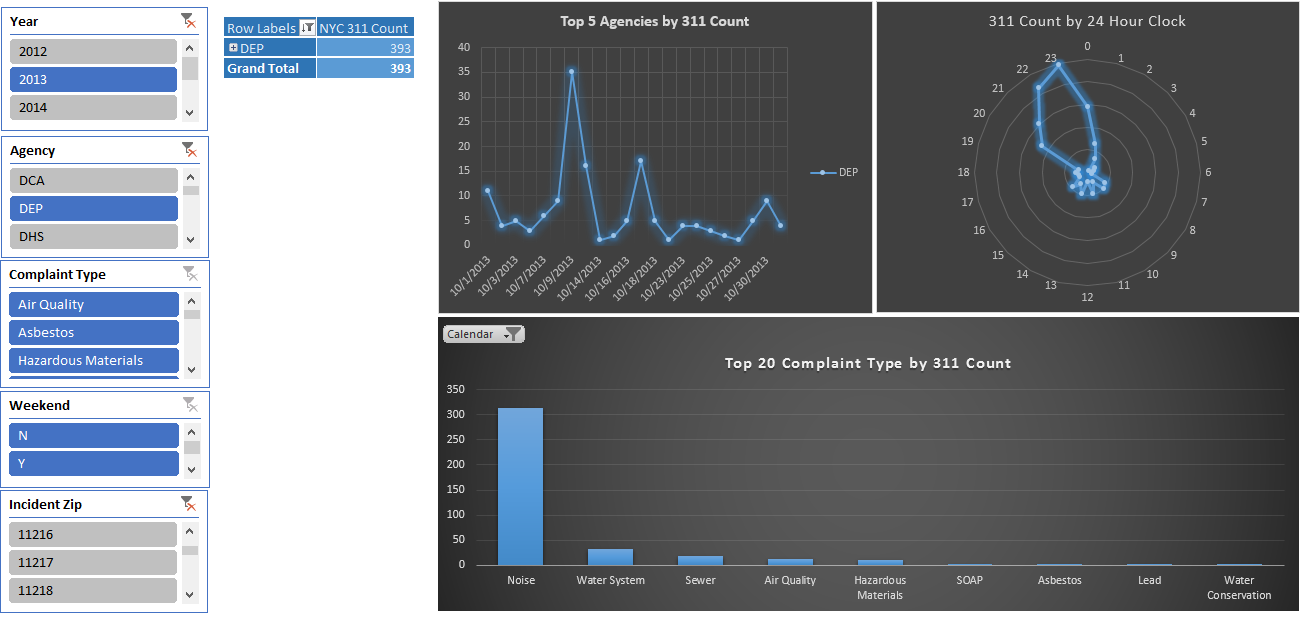
Filtering for the Agency DEP in the left side slicer, and then double-clicking on the month October 2013 in the chart shows that the data contains a large count of service requests on October 9th, 2013. The 24 hour clock shows that a high volume of service requests in that month were in the 9pm-12am range. 313 of the 393 service requests were for “noise”:
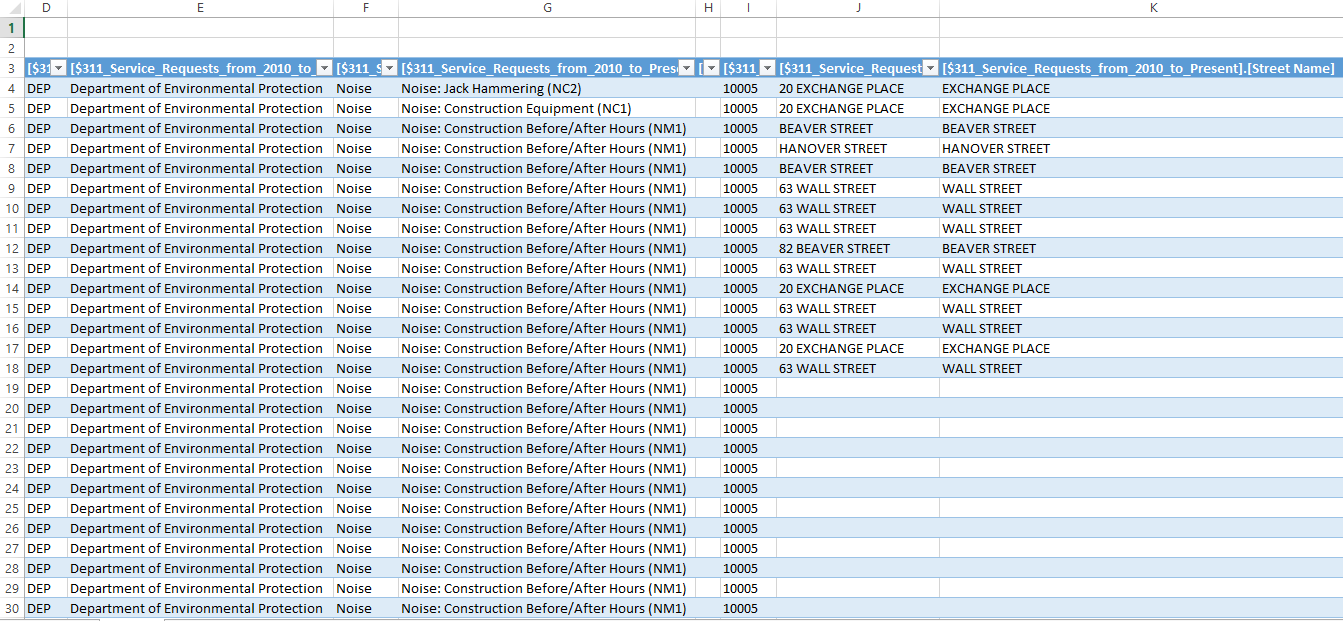
Finally, double-clicking on the NYC 311 Count value yields a list of individual service requests that can be used to determine the details behind the data for zip code 10005, in 2013, for the Agency DEP, on October 9 2013:
Our next article will feature New York City restaurant inspection results mashed-up with 311 Service Requests data. Stay tuned, and please provide any feedback or suggestions in the comments or on our Feedback page.