Liquor Open Data from British Columbia’s DataBC Platform and BC Liquor Stores
 Need a break from browsing accounting ledger open data? Take an hour to browse the BC Liquor Store Product Price list which is available on British Columbia’s DataBC open data platform. You might find the data to be interesting and useful, and the hour that you spend working with it might even be happy.
UPDATE 7/10/2014: I have created an interactive, WordPress embedded dashboard using this data at this link.
British Columbia has an open data platform, called DataBC, and on it is available a data set from BC Liquor Stores named BC Liquor Store Product Price List – Current Prices. The data set contains information about liquor product pricing, units per package, alcohol content, liquid and volume, along with country of origin and a classification hierarchy. In other words, the data set is ideal to pour through using an interactive business intelligence tool.
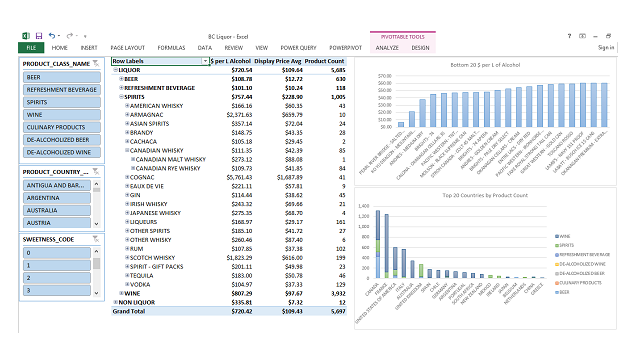
In the screenshot examples below, I pulled the BC Liquor Store Product Price List into Excel 2013 with Power Pivot. Using the source data I was able to assign a classification hierarchy (see the drill-downs on the Pivot Table) and create new calculations $ per L of Alcohol, Display Price Avg, and Product Count. The slicers on the left side of the page filter the Pivot Table and both Pivot Charts. The upper right chart shows the top 20 liquor products offering the most affordable price per L of alcohol. In other words, it provides a list of the products with the best bang for the buck. The bottom right chart shows a count of products by country of origin, broken down by Product Class Name:
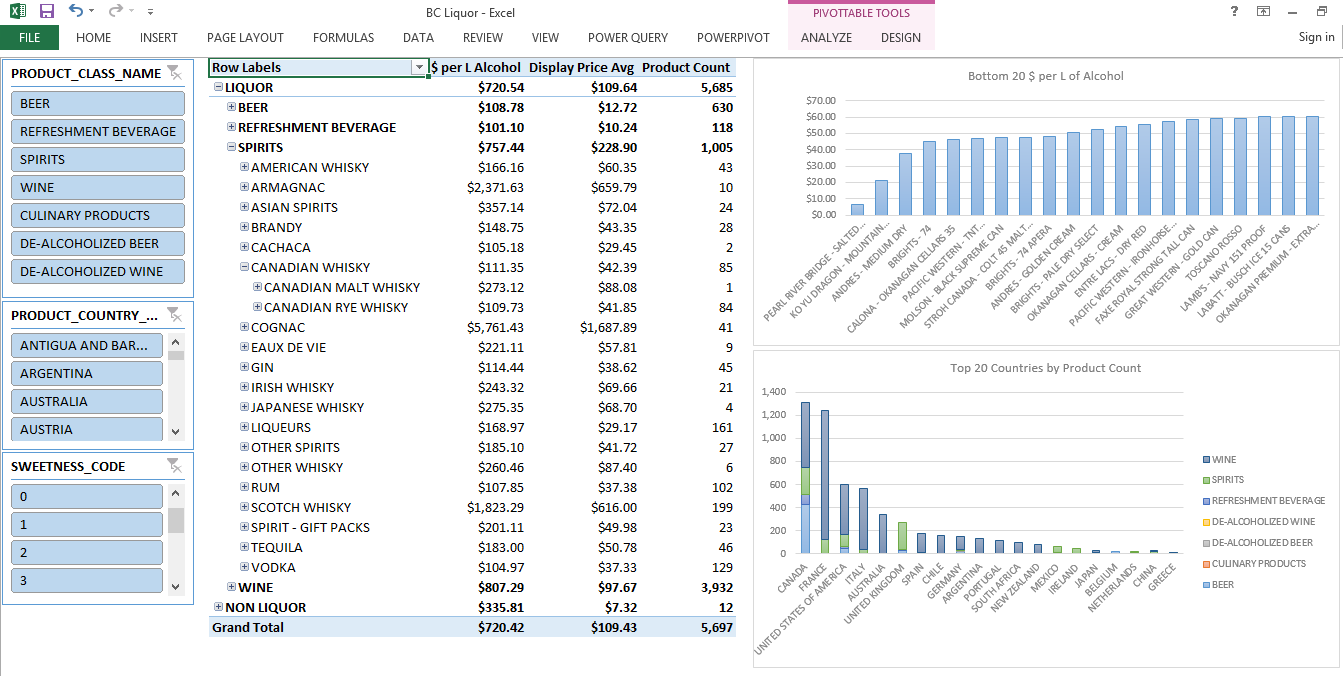
Slicing the report for “Beer” changes the values on the report. Notice that “PACIFIC WESTERN – TNT STRONG CAN” contains the most alcohol for your money at $47.05 per L. Using TNT in the name appears to be an accurate description. Looking to the bottom right, it is obvious that the vast majority of beers on the list are from Canada:
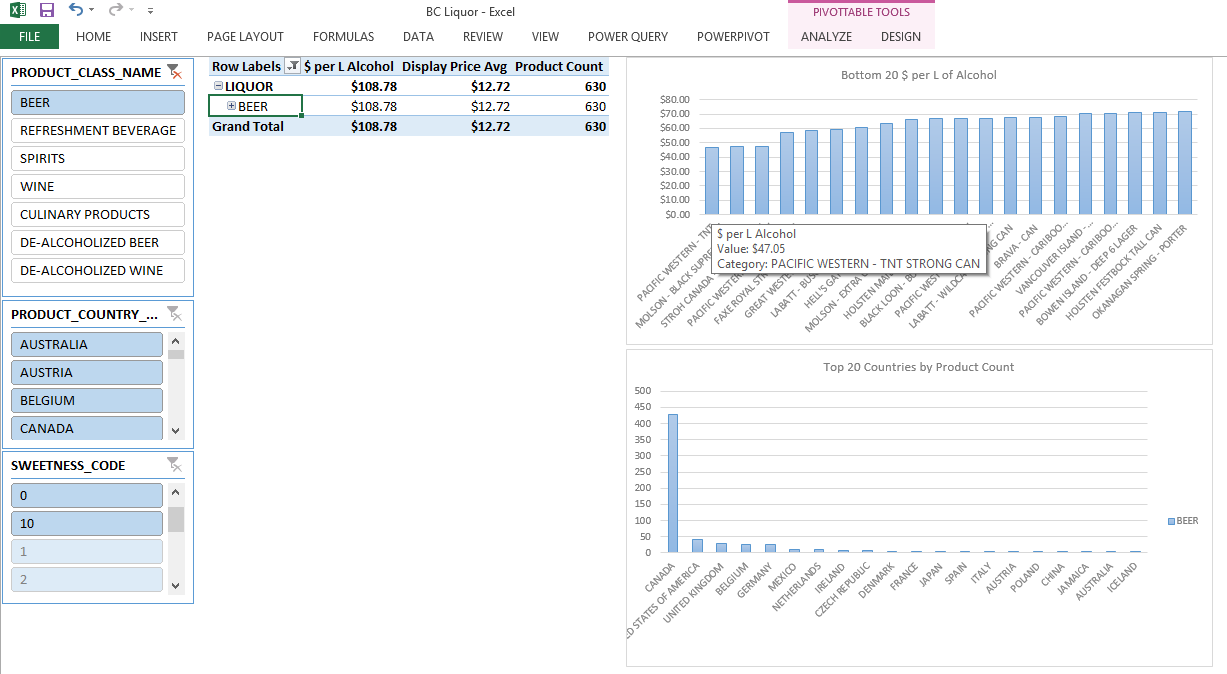
Filtering for both “Spirits” and “Wine” shows a different perspective. Expanding the hierarchy from “Spirits,” to “Canadian Whisky,” to “Canadian Rye Whiskey” gives a detailed list of products and their pricing on the Pivot Chart. You can also see in the bottom right chart that France has the most total products in this subset, mostly due to the orange part of the bar which is for “Wine”:
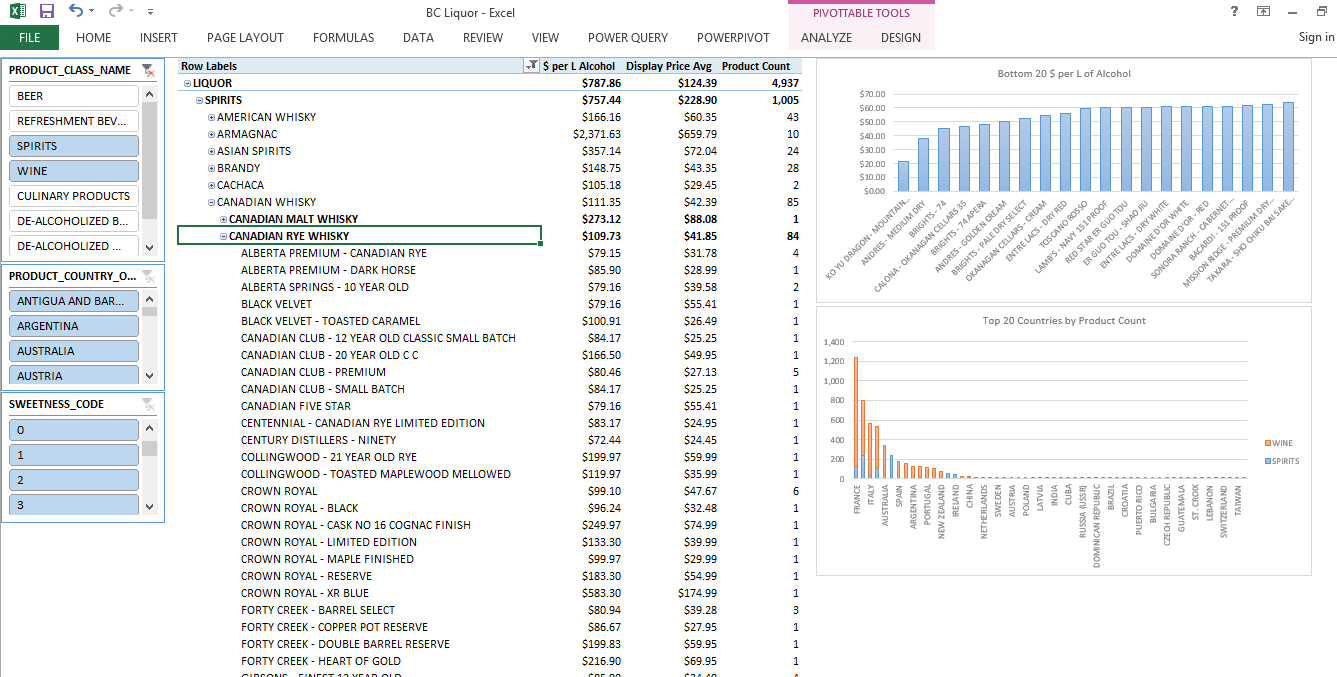
Filtering just for the United States, and expanding “American Whisky” reveals the American Whisky products on the Pivot Table from the data mashup. A sour mash mashup:
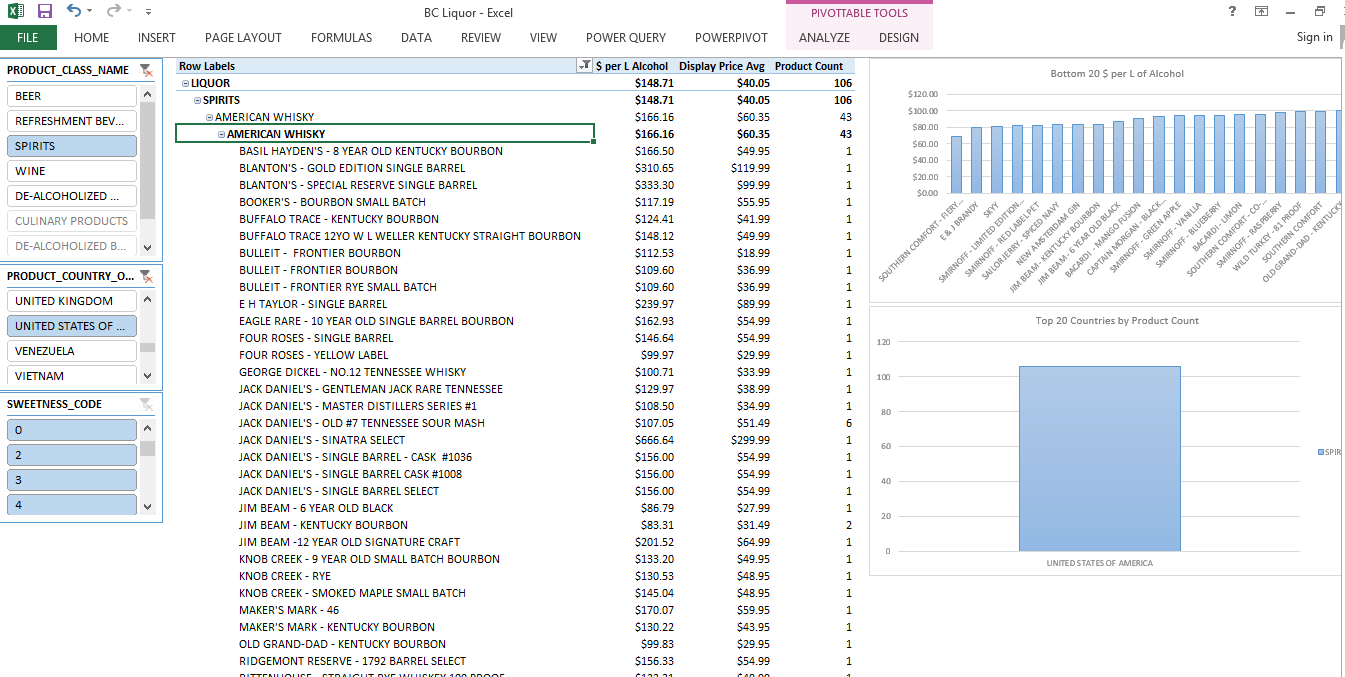
The BC Liquor Store Product Price List from British Columbia’s DataBC open data platform is proof, rather very high proof that open data can be diverse and interesting. Learn more about the data, their open data usage license, and explore other British Columbia DataBC open data sets from this link. Soon enough you’ll be distilling your own results from open data.