Combine Chicago Crime Data with Census Data for New Insights
The City of Chicago provides access to crime data through their open data portal. Another data set at their portal, which originates from an entirely different source, is for census data of socioeconomic indicators from 2007 – 2011. These two data sets can be combined in a mashup that offers new insights into the relationships between socioeconomic factors and crime in Chicago.
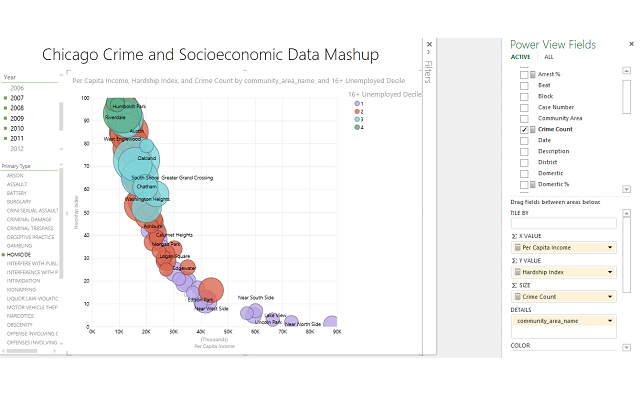
The video at the top of this page illustrates the types of insights that can be gained from mashing up Chicago crime and census data. If you’d like to build your own version of this data mashup, we have several resources available to guide you along the process. Once you are proficient with the process, you can build your own data mashups in a matter of hours using a home computer.
A video that gives greater detail about the process of importing Chicago Crime data can be found at this link. The video also details the process by which to mash up the data set with San Francisco crime data.
A page containing instructions to guide you with data modeling for Chicago crime data is available at this link. The Open Data Bits blog post about this data set is available here. Step-by-step guidance for importing and modeling Chicago Socioeconomic Data is available at this link, and the corresponding blog post is available here.
The Chicago Crime Data can be tied to both Time and Date Dimensions, which can in turn be used to mash the data up with other data sets from around the world. All of the data sets that Open Data Bits has featured with step-by-step guides can be found at this link. We also provide free downloads for Date and Time dimension spreadsheets.
Please do not hesitate to reach out if you have any questions about the process. Our mission is to make open data mashups easier for you, and feedback and networking is always welcome.