An Interactive Data Visualization Dashboard of San Francisco Police Reports in 2013
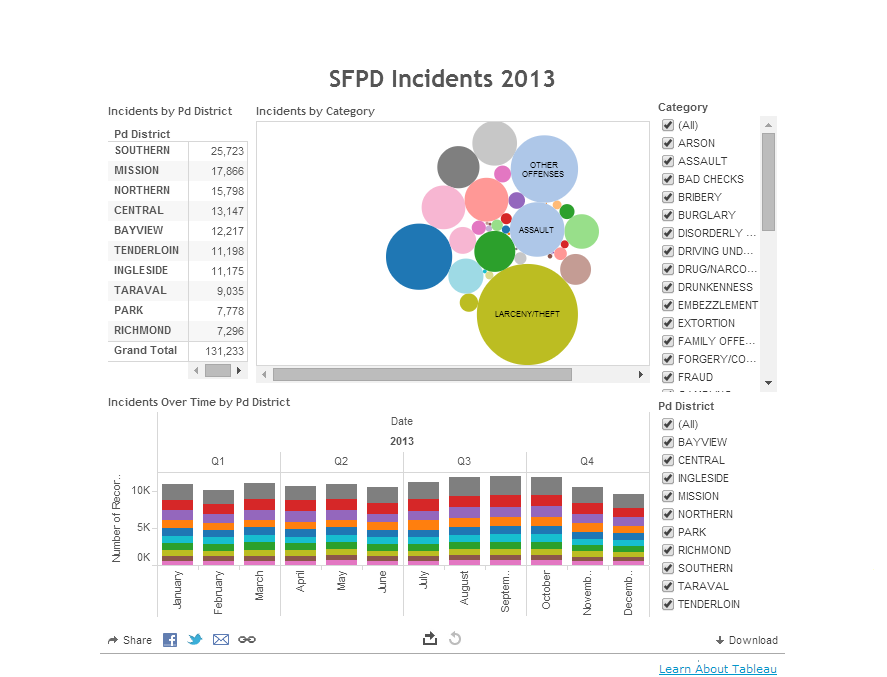
San Francisco Police Reports 2013 Dashboard
(click the filter values and hover over bubbles and bar graph colors, it’s interactive!)
The above dashboard visualizes San Francisco Police Department Incident Reports for the year 2013. Tableau Public was used to create this dashboard. The added bonus of using an interactive, dynamic dashboard is that you can filter the data and modify the detail levels on the charts and table. Go ahead and select different report “Category” and “Pd District” values to watch the data visualizations change. You can click the “+” and “-” buttons by the months and quarters on the bottom bar chart to change the detail level of the data by date aggregations, too.
I’ve previously published articles featuring this San Francisco Police Reports data, which are linked below if you’d like to explore the data further or start building your own dashboards:
San Francisco Police Department Reported Incidents Open Data
San Francisco Graffiti Reports and SFPD Reported Incidents Data Mashup
Instructional Video to Mashup Chicago and San Francisco Crime and Police Open Data
SFPD Reported Incidents – 2003 to Present (a documentation page to help you build your own data model for a dashboard)
The source of San Francisco Police Reports data, along with open data licensing information, can be found at this link.
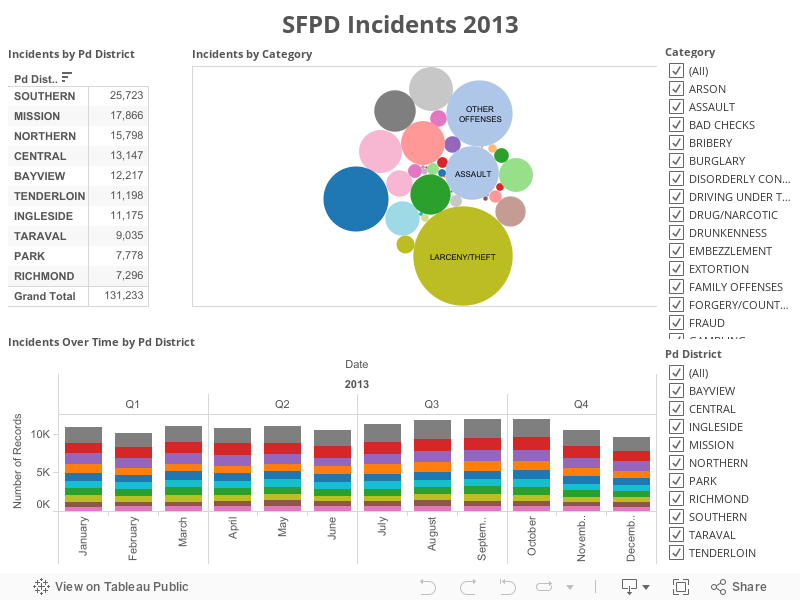
If your browser or device does not display the dashboard at the top of the page, here’s a screenshot: